
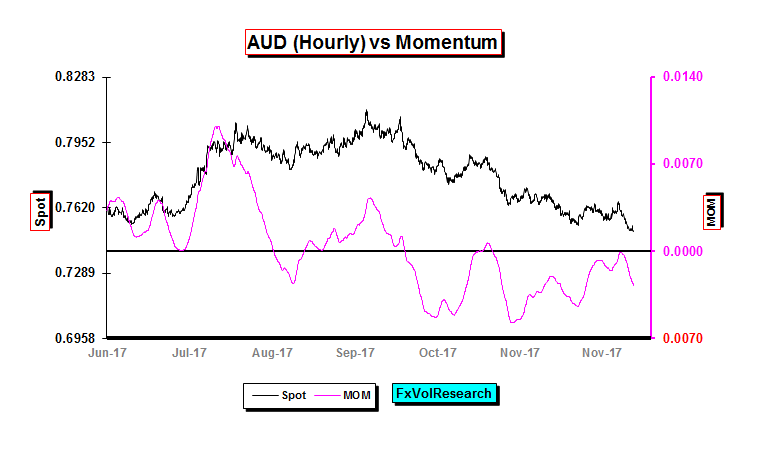
It is not unusual for the Australian Dollar to have a 5 cent correction over a six month time horizon. We have been encouraging the shorting of the AUD from the 80cent level and now that we are approaching 75 cents we believe this is a good point at which to bank gains. The erosion in the AUD has not come in a volatile fashion. Indeed AUD vols have generally been declining and at the same time the AUD risk reversals have in our view remained cheap with regard to AUD puts relative to calls.
Short term momentum as you can see above has remained in negative territory, and we have bounced off of par. In our view, it would not be at all unreasonable, particularly at this time of the year for the AUD to start to consolidate and pressures re-assert themselves on the premium levels. This may well present a good buying opportunity at the back end of the curve where there is, at the moment, the greatest value.
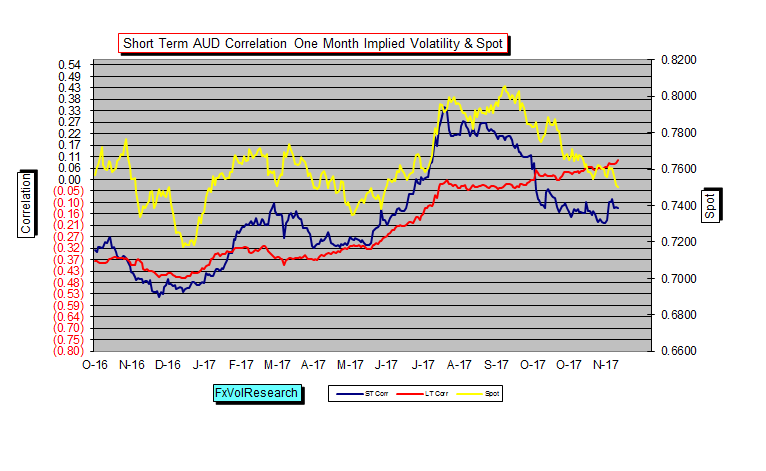
The correlation of one month implied volatility and spot in the AUD has — over the past cycle — been a good leading indicator of direction. As you can see from the chart above the ST indicator is leveling off a the same time and this may well along with the momentum chart above be a further indication of the AUD decent may be starting to abate.
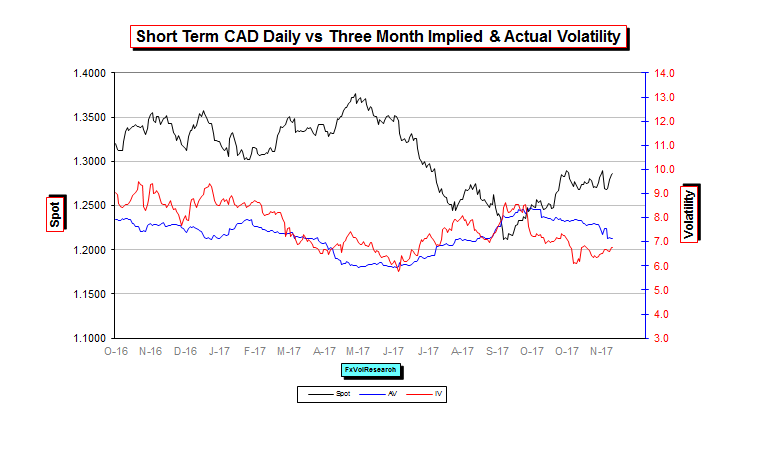
As the CAD has consolidated in the short term between 1.2675 and 1.2925, realized vol has declined while a the same time the implieds have bottomed, and as a result, the wide gap between the two has narrowed to the point where the 3M implieds are now just under the realized vols. Fundamental releases last week have been broadly neutral.
The trade numbers came in better than expected, but these numbers can be interpreted as another sign of weakness in domestic demand. Building permits were undeniably strong. One stat that the market seems to ignore is productivity and this number came in weak. It has long been our view that a sustained rise in the CAD requires a backdrop of improving productivity and these numbers simply do not bear this out.
Finally, broad measures of commodity prices started to show some weakness. In particular the DJ Commodity Index, as well as the price of copper. Oil tried to break down back below 55 and failed and remains confined in a 55-59 range.
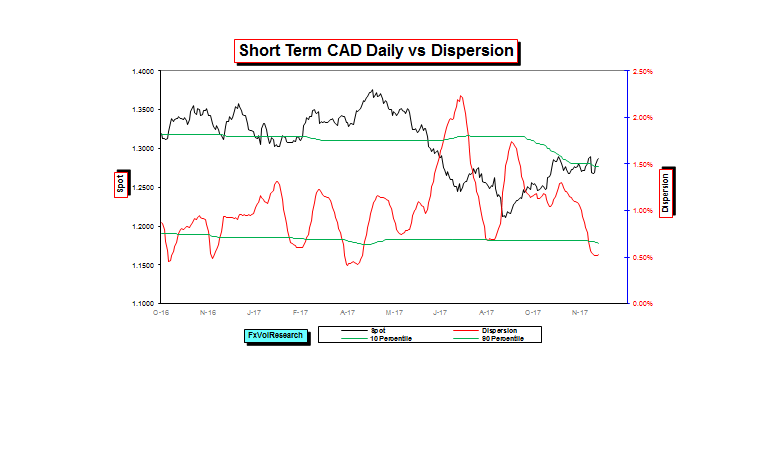
Not surprisingly, CAD dispersion has declined as the spot has remained range bound. This has put the reading now below the 10 percentile rank in the chart above, but it may now be starting to level off. It may continue to do so for the balance of the year & if this does, in fact, occur it will increase the odds of trending price action developing in the New Year. We continue to view the 1.3000 level as a good place to take profits on short CAD positions.
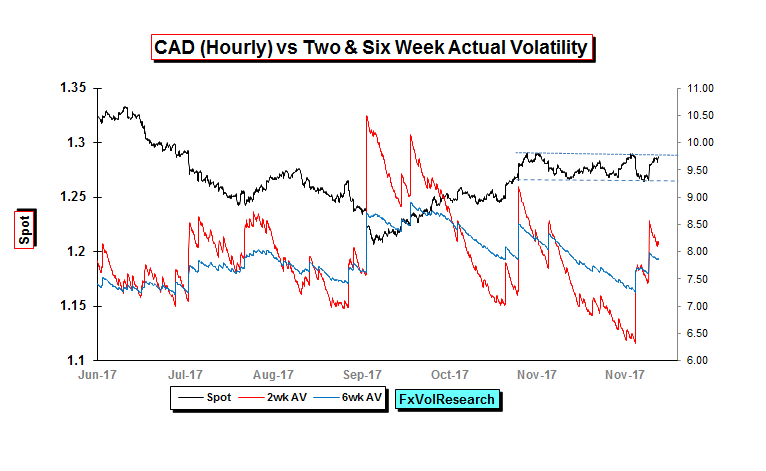
Even though the price action has been consolidative, it remains choppy. So short-term hourly actual vol remains high and the two weak measure has broken over the six weeks. Short dates as you can expect did not end the week offered and at the moment we do not see any edge in buying the gamma type options. In 2017 they have generally proved a good buy in the mid 5.5 range. The one week IV ended on Friday near 7%.
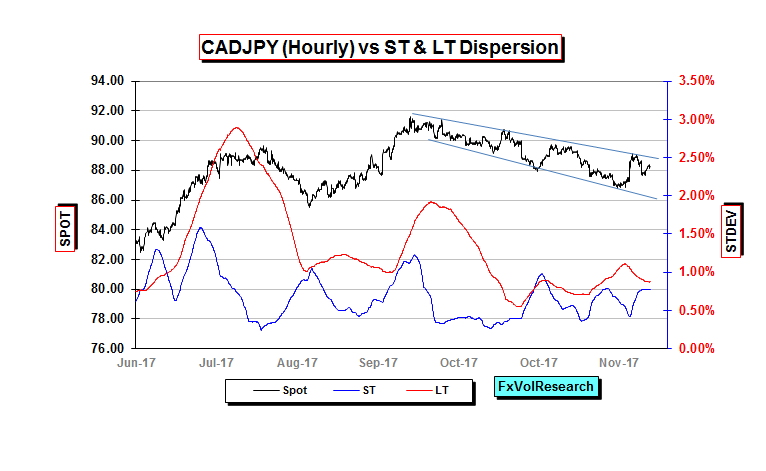
CADJPY remains in our view in a broad down channel and while dispersion is low, it is still trending higher. A re-test of 86 remains our preferred view.
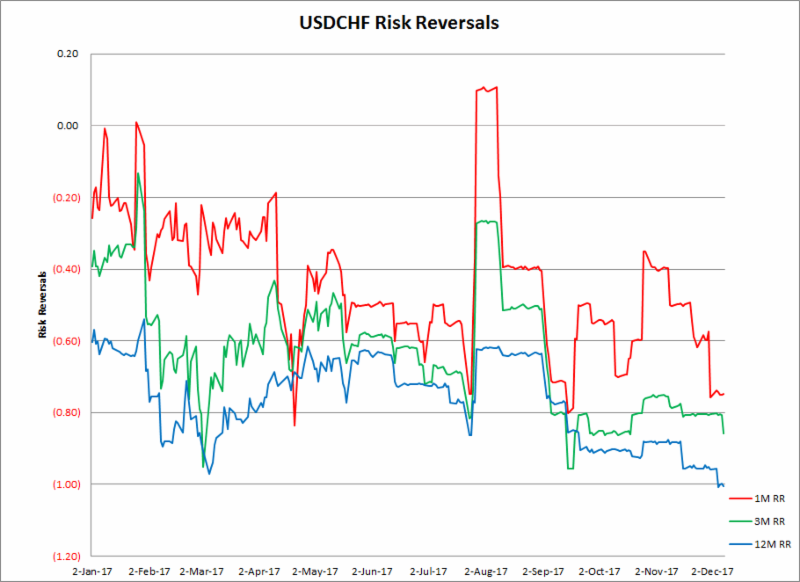
Last week EUR risk reversal moved lower having topped out at levels according to our internal rankings remain expensive (price of EUR calls relative to puts). This last week CHF risk reversal moved better bid for CHF calls, and as you can see in the chart above, this was particularly the case in the one year.
The bid in CHF calls represents the risk-off fear and the rise in the risk reversals is a good representation of this in the market. While implied vols in the CHF remain cheap, the skew is increasing relative to the at-the-money options. This is very similar to the combination of low at-the-money vol with high put skew seen in stock index options.
The one year is now below the 10percentile in terms of historical readings according to out our models. The one year CHF RR has gone lower than this but only on a small number of occasions that were associated with sharp CHF spikes & risk-off events.
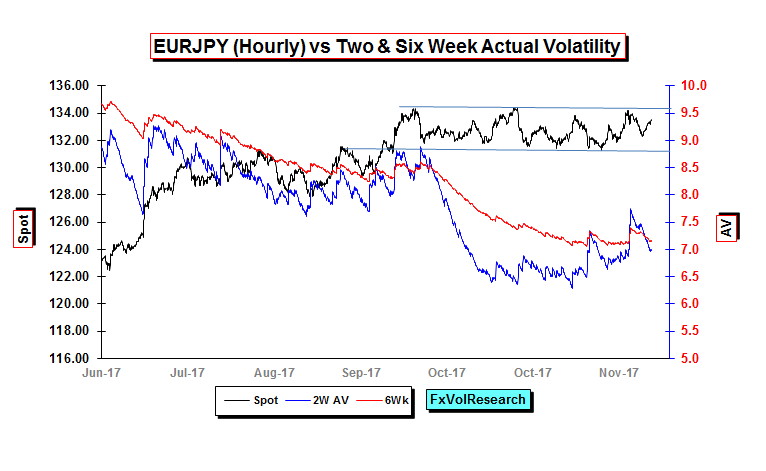
The chart above shows the clear sideways consolidation of EURJPY and the failure to date of short-dated actual vol to sustain a rising trend. Nevertheless, the implied vols in the curve moved up slightly last week as we noted above.
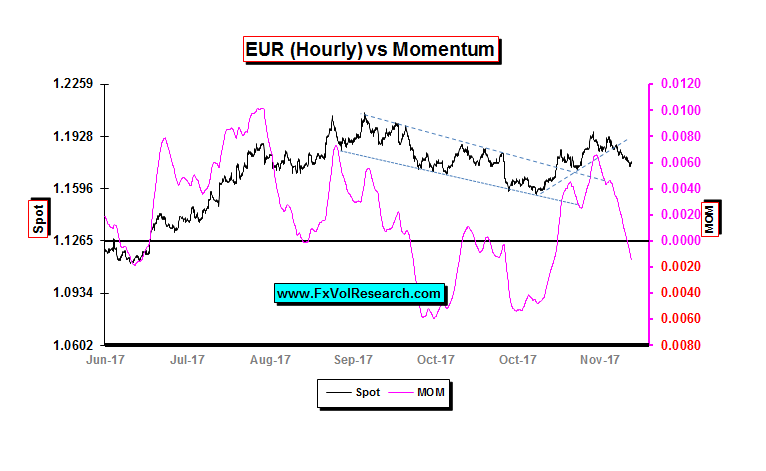
EUR momentum has turned lower into negative territory. However the spot has not yet taken out the top end of the previous channel (in the chart above). In our view it will have to do this to confirm a renewed down trend. Based on interest rate differentials alone, the dollar should be higher. What is keeping the EUR higher are concerns about the current US administration and the potential for a constitutional crisis.
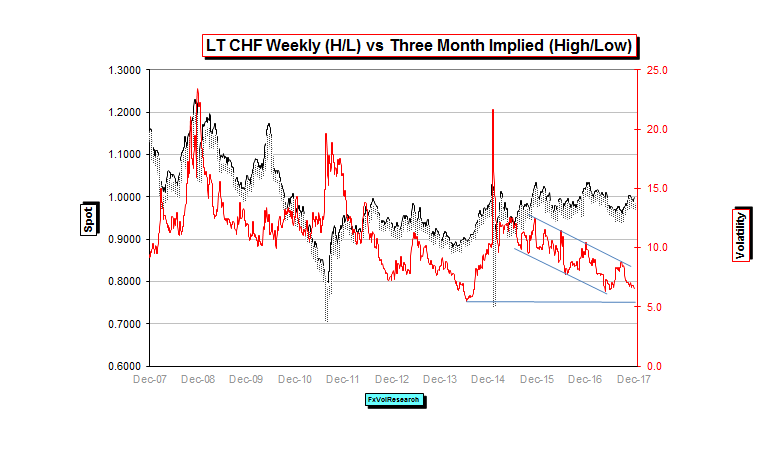
The chart above is the 3M CHF implied vols going back 10 years. CHF implied look very likely to re-test their lows of 2017 and may well even succumb to enough selling to reach the lows in 2014 (see above). As pointed out above low ATM vol does not imply cheap skew, as CHF calls remain pricey particularly in the back end of the curve.
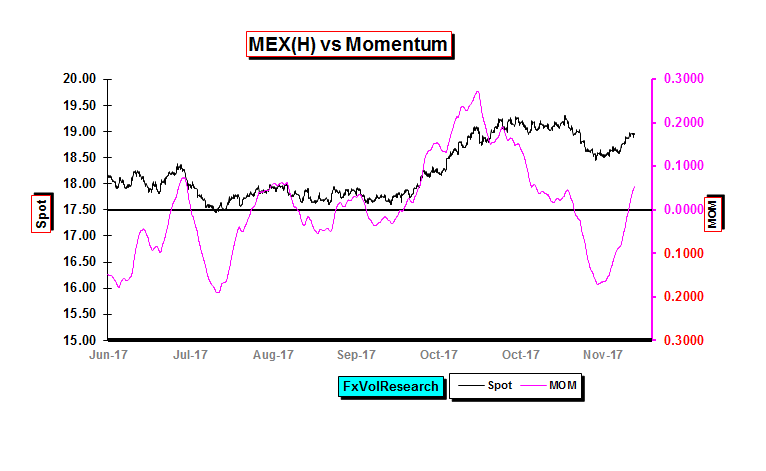
The MXP correction seems to be starting to unwind and the 1M and 3M RR are moving slightly better bid for the US$ calls, but the one year is holding stable. The spreads between IV and AV remain elevated and the short dates are broadly in line with the actuals.
Source: James Rider – http://bit.ly/2jOX1em


