

EUR long term momentum is showing some signs of turning. However the overall signals are mixed. (see below).

Short-term correlation of one One month EUR implied volatility and spot
is nearly making a new high with potentially bullish EUR implications. The GOP tax cut is already priced into the market with the 10YR yields failing once again to close over 2.40. You have to ask yourself whether this tax bill is really of any consequence in the near term.
It may have longer-term negative implications, but unlike the rally in the dollar following Trump’s election, this time the market seems to be unimpressed. The reason is that during the election campaign Trump talked up infrastructure spending and the market took it seriously. However, the Trump administration in practices has proven to be quite different from the one during the campaign.
The US deficit now set to rise by 1T – 1.5T. Now the ability of the US government to enact serious infrastructure spending is reduced. Infrastructure spending would have had good LT implications primarily in the area of increasing US productivity and potential growth. Bond yields will eventually have to rise to fund the US current account. It is not a long term dollar positive.

On the contrary, the risk premium associated with EUR calls in the risk reversal has declined from levels that as we have been saying are expensive on a percentile basis.
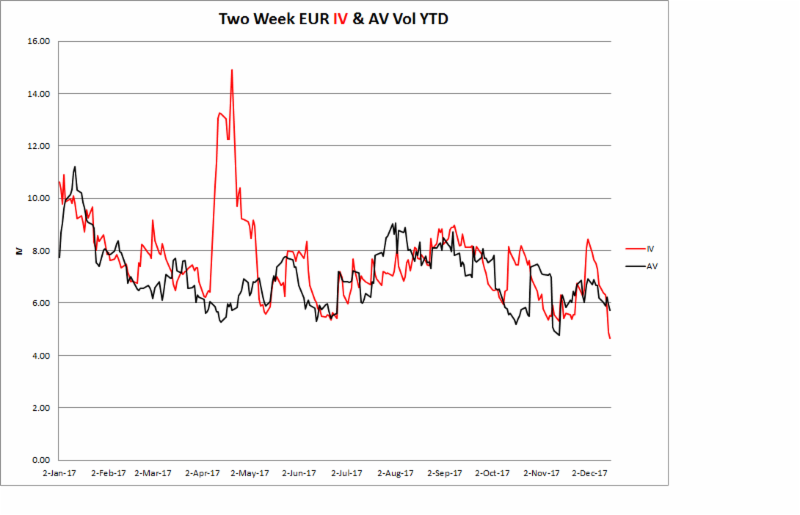
Ahead of the holidays, the short dates are getting crushed in many currency pairs. EURUSD is a good example fo the two-week EUR IV making a new low for the year and the wide (negative spread) in the two weeks IV-AV spread. This gamma is too cheap. The one month, which will take in the Jan NFP is also looking underpriced.
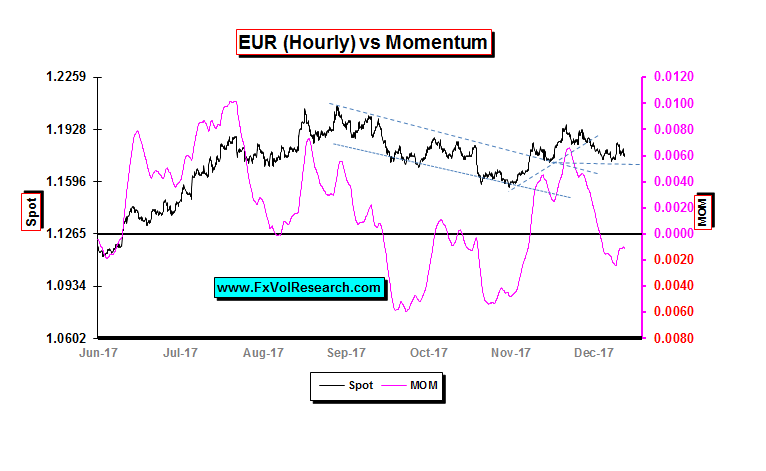
Short term momentum is holding in slightly negative territory however as you can see in the chart above the EUR is still holding above some short term support.
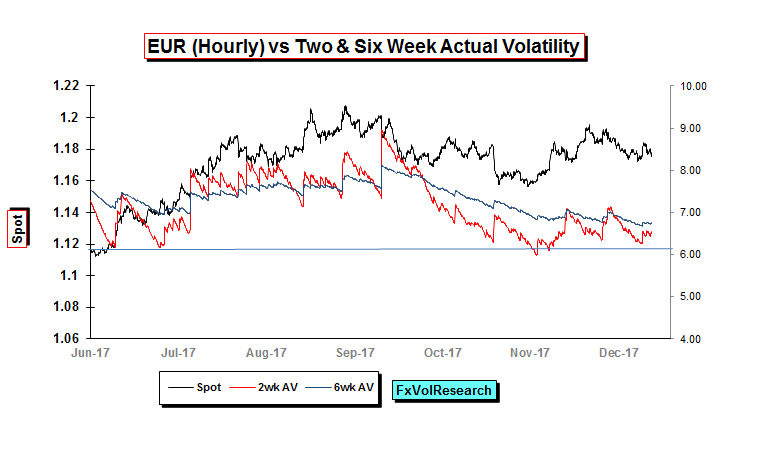
Despite the sell off in the front end of the curve to levels under 6% the two week actuals are holding above 6%. In 2017 two week AV has found solid support at the 6% level.
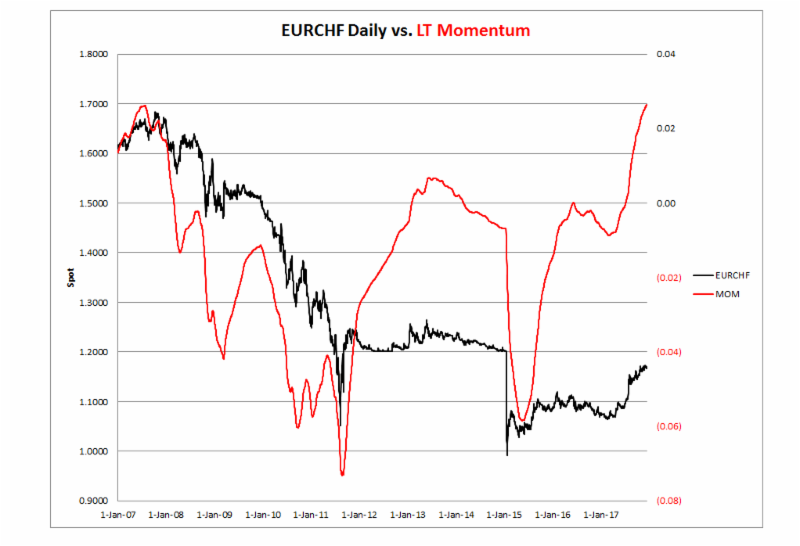
LT EURCHF momentum is back to the previous highs from 2007.
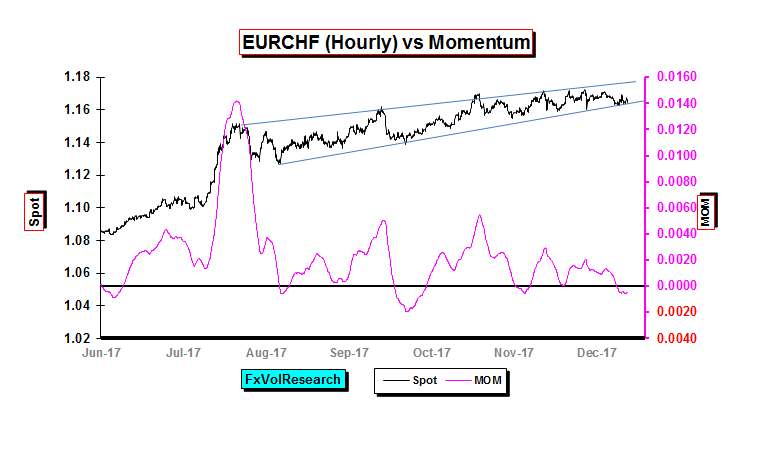
Looking at the hourly chart EURCHF maintains its upward trend, however, momentum is slipping.
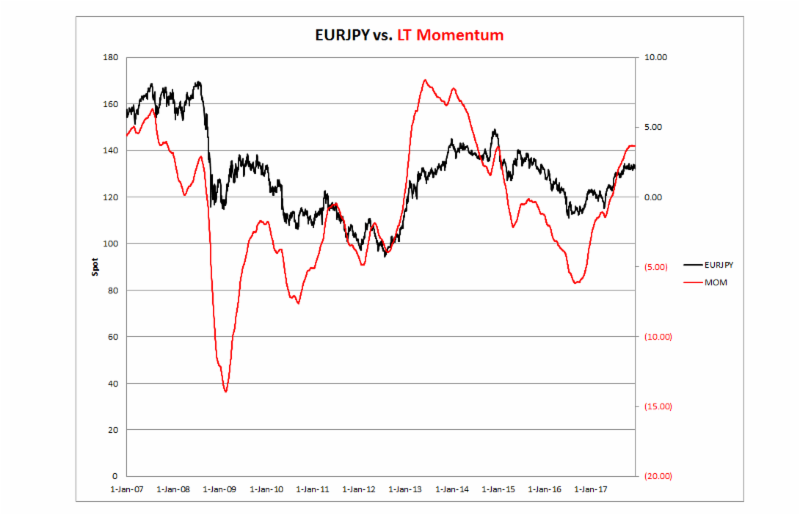
EURJPY LT momentum while still not yet at previous high is nevertheless starting to look tired.
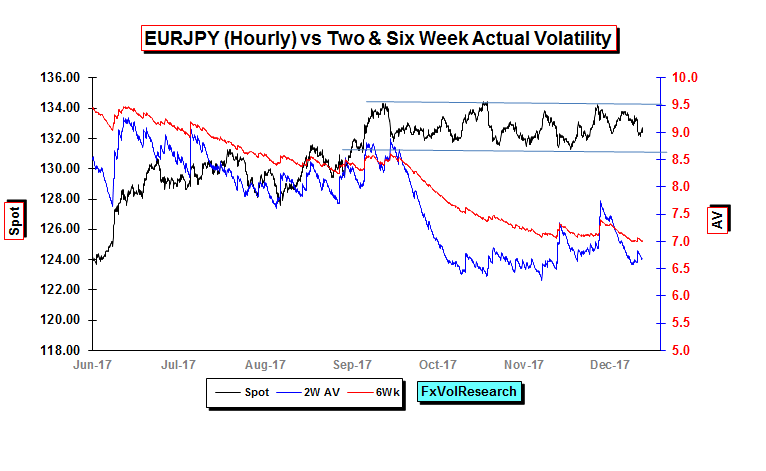
EURJPY holds its hourly channel pattern while actual vol is declining. At the same time, EURJPY 3M vol of vol has declined still further (not shown). The implication is that this period of sideways consolidation cannot go on much longer.

The GBPJPY uptrend break high is also now in doubt as last weeks price action takes us back to support the previous trend line. We were hoping the market would overreact and take GBPJPY up to 159/160 where it would prove to be a great LT short. This has not happened yet but remains a trade that we have put on the back shelve to be rolled out later when the indicators are more in alignment.
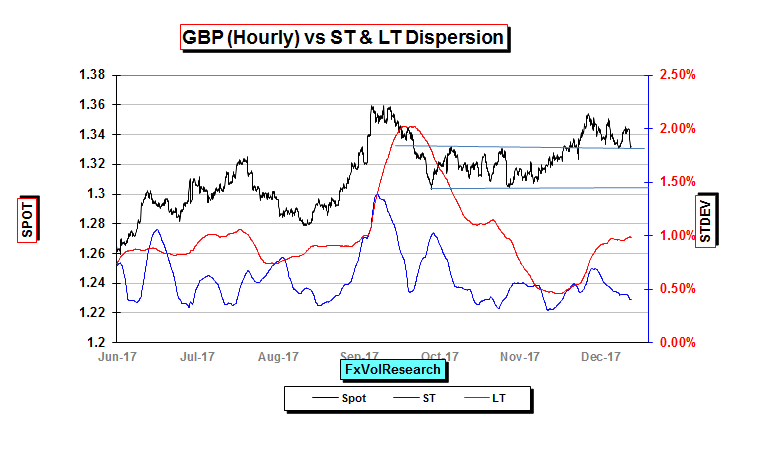
Same pattern in GBPUSD. Takes out the channel but now comes back to the to end of support. If it breaks could suggest a retest of the bottom of the support channel at 1.3050.
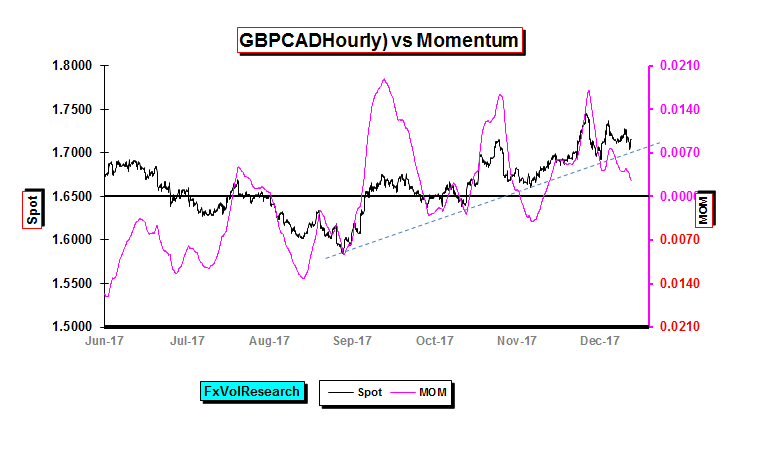
GBPCAD is also testing the hourly trendline as momentum is declining at the same time.
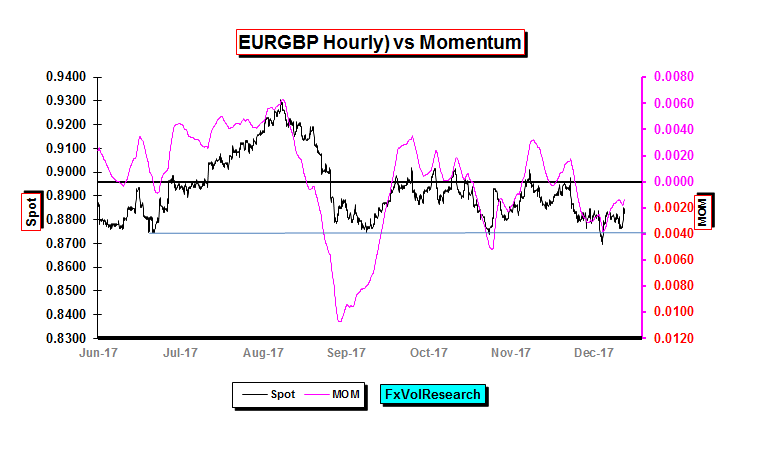
Tried to test lower with a break of 8745 but now has recovered back into the channel. Within the channel, the price action remains choppy and EURGBP actuals have steadily risen. The next two weeks with be critical for the May government.
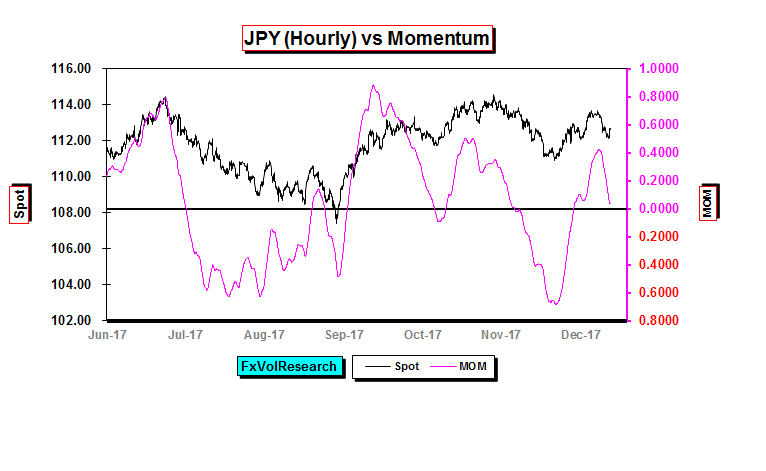 The yen is losing topside momentum. Yen volatility declined in line with the rest of the G-10. Three-month yen traded under 8% where it has generally found good support in 2017, making a new low for the year.
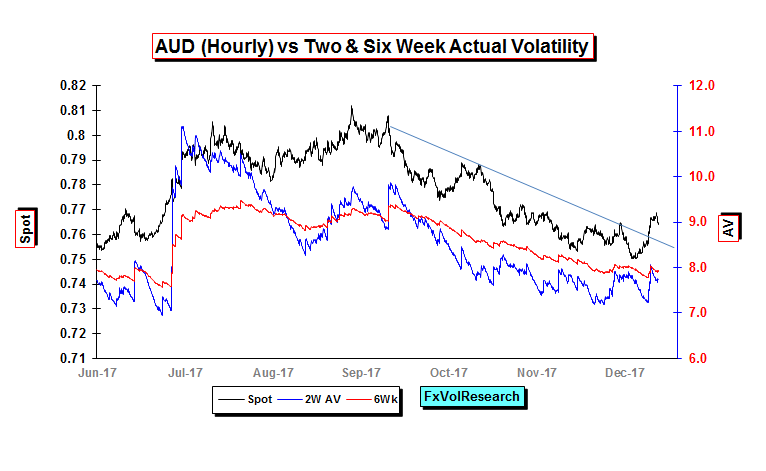
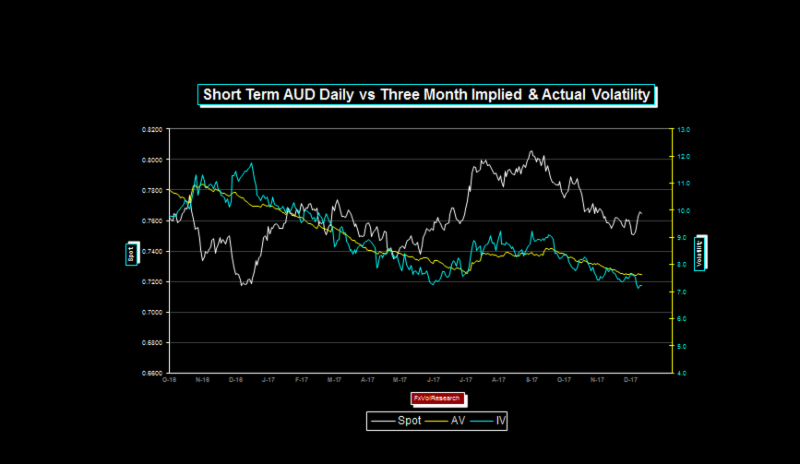
AUD takes out the downtrend. If we now get a period of price consolidation AUD vols can go lower still. We may start to see the 3M trading in the mid 6% range.
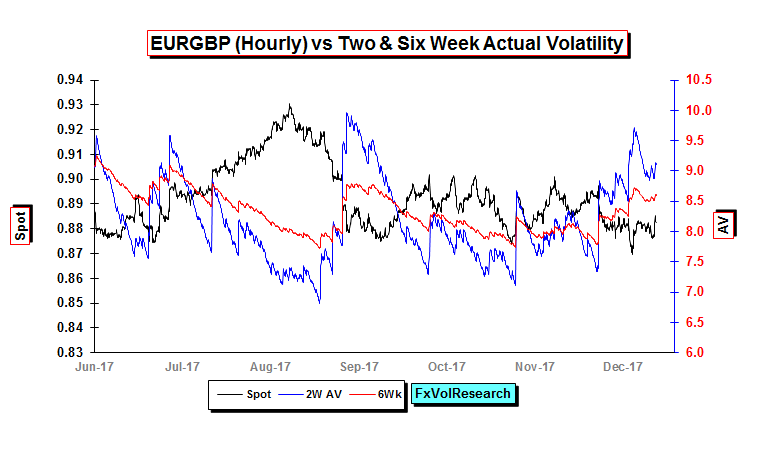
With the actuals remianing lively, short dated EURGBP implied vols should not come off much further.
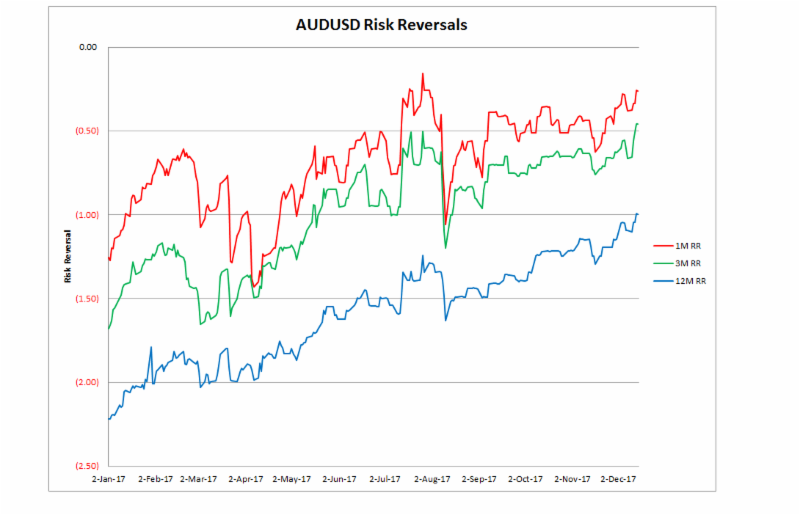
As we have pointed out here in the last few weeks AUD Risk reversals have remained cheap despite the move from over 80cents to 7500. Now tha thte spot is well off its lows the risk reversals are getting cheaper still. The three month is making a new high for the year.
The implication is that if the AUD declines further ti will do so in a gradual fashion. If you want to take the other side of this you may want to own 3M 15delta AUD puts X2, and sell X1 3M AUD 25Delta calls and dleta hedge. If the AUD falls quickly the 2X 15 delta puts will expand very quickly.
The cheapest options in our data base are CHF, GBP, AUD, and EURJPY. The CDN dollar curve is close to its long term averages along with EURCHF. The MXP curve is expensive & particularly so the one year.

Still on course for a test of 86.00.
 Hourly dispersion heading lower. The odds of a significant trend developing in the next week are low but much more likely following the holidays. Any negative NAFTA news will take us to 1.3000 quite easily where we would cover CAD shorts.
Source: James Rider – http://bit.ly/2zjJBPH


