
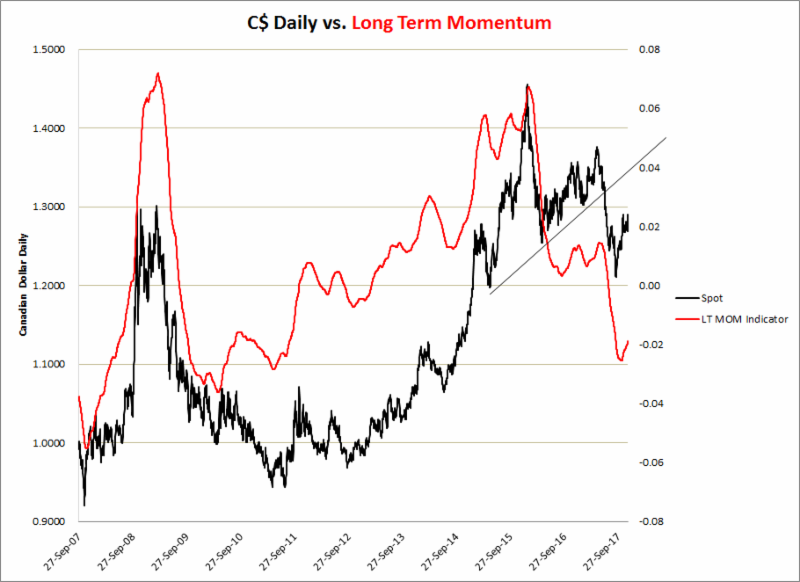
USDCAD LT momentum now shows clear signs of turning up from being in the slightly negative territory but we are not yet back to neutral. The employment report on Friday was the catalyst for the sharp CDN rally at the end of the week. However, the GDP report that came in at the same time showed growth slowing to 1.7 in Q3.
In order to believe in sustain CDN strength, you have to have the view that the commodity complex has further to run on the upside in line with global growth. Admittedly, WTI has been firm testing and trying to take out the 59$ level. However copper has been consolidating at levels just over 3$ a pound, while the broad commodity complex as measured by the DJ Commodity index is admittedly, grinding higher but with declining volatility. The commodity complex is a support for the CDN $ (and AUD) but it may well be a support that is diminishing.
An acceleration of commodity prices will depend on still further growth in the global economy. Finally, weak CDN export numbers may also be a sign that China is succeeding in re-balancing growth away from exports towards domestic consumption (may also apply to Australia). Secondly, the CDN bulls have to be assuming a successful renegotiation of the NAFTA, an outcome that is very much in doubt. Finally, there are still substantial headwinds with respect to the housing market, changes to lending requirements that are a response to elevated levels of private debt.
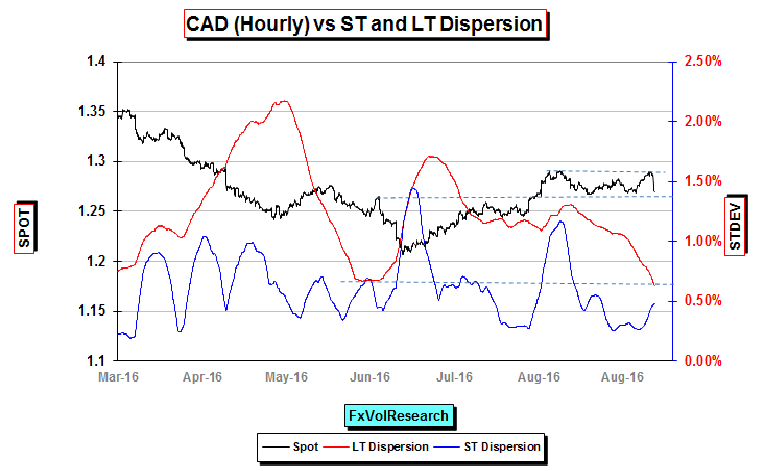
LT Dispersion is testing its previous low, which is suggestive of further consolidative price action. The upper and lower bands of the range are 1.2920 and 1.2675. The CAD employment report on Friday lived up to its reputation of being a random number generator and came in well ahead of expectations. Prior to the release of the employment report, one week actual vol of USDCAD was running at around 5.85% using our Hourly data.
Following the number, it spiked to close the week at 8.55. Six weeks CDN actual vol prior to the number was running at around 7.2, and after the number, it ended the week at 7.7. One week implied vol ended the week at 7.9 and the previous Friday close was just over 6%. This bears out the recent theme that we have been highlighting here that CDN gamma has been worth owning at levels under 6%. In order to extract this gamma though you have to monetize it from active rebalancing.
Still, these numbers represent an inefficiency that exists in the FX market from time to time and in this case, it has had a certain degree of persistence. As we move further into December markets will get thinner and trading ranges can be widened still further providing still more active gamma trading opportunities leading up to the XMAS holiday.
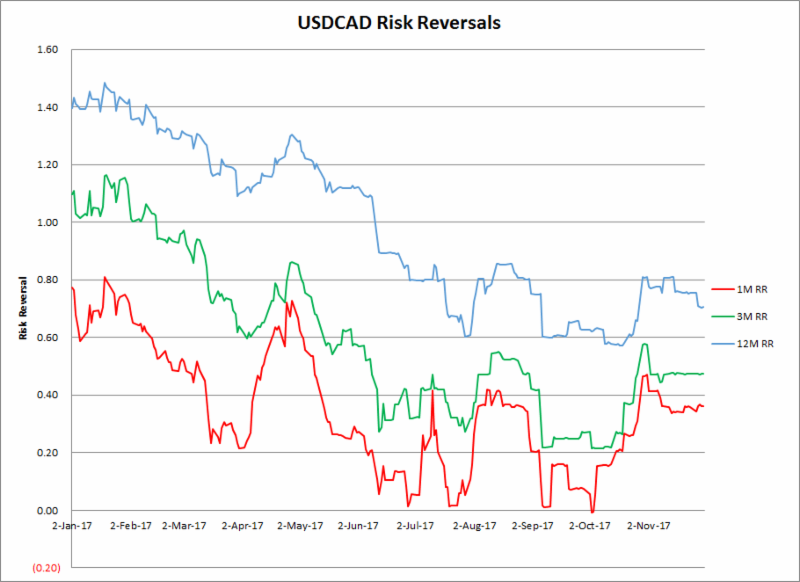
Following the sharp rally in the CDN $ following the employment report, one would not be surprised to see the risk reversals move lower (better bid for CAD calls vs puts). In the front end of the curve this did not occur with both the one month and three-month reversal holding stable, however, the one year did move slightly lower.
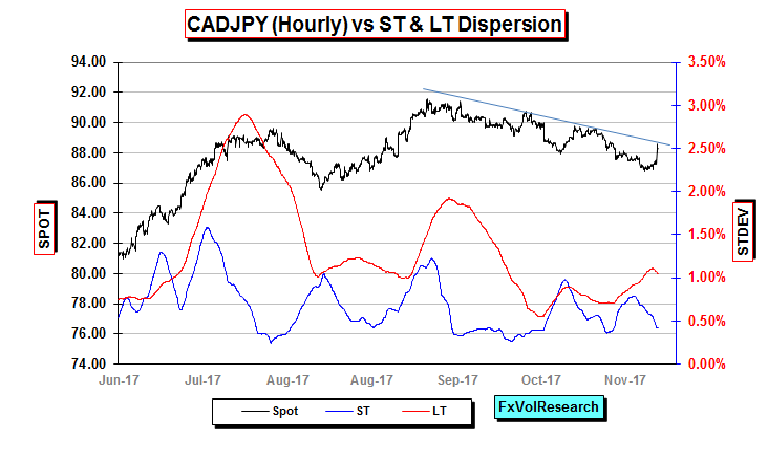
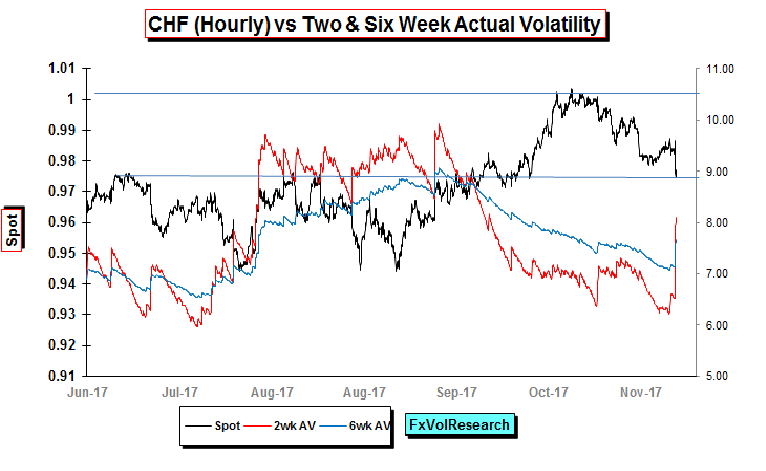
The sharp CAD rally on Friday did not (yet) take out the top end of the hourly trend line. It also led to a sharp spike in short-term implied and actual vols. Two weeks AV prior to the CDN employment number was running at 7.5% (and was a recent cyclical low). Following the number two week actual vol rose to 12%. Two weeks implied vol ended the week at just under 9%.
We have been emphasizing the narrowing recently in CAD-Cross vol volatility and the clear opportunities presented both for corporate hedging and limited loss directional option based trades. The spike in CADJPY left momentum still in negative territory but less extreme than we observed in the week prior (not shown).
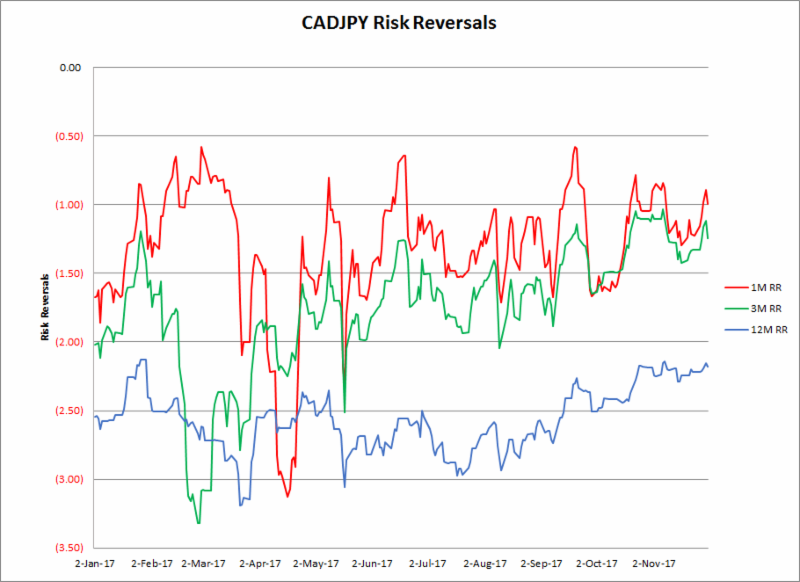
CADJPY risk reversals look cheap for Yen calls, just by looking at the YTD data. The one year, in particular, is back to its previous high seen in January.
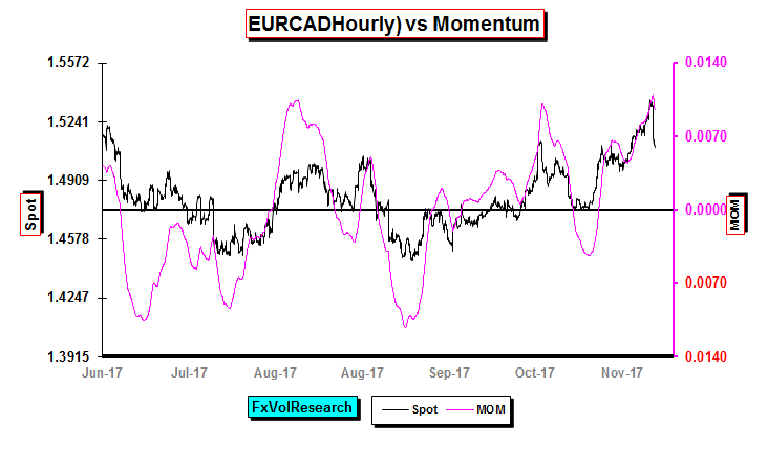
EURCAD momentum tops out and turns slightly low on the CAD rally vs the EUR. At the same time, the EURCAD risk reversal moved still further better bid for EUR Calls over CAD. In particular, the one-year EURCAD risk reversal made a fresh new high at just under .80 premium for 25 Delta EUR calls over. This is a continuation of the same theme we have seen in the EURUSD, namely, the market is very wary of being short EUR calls in general.
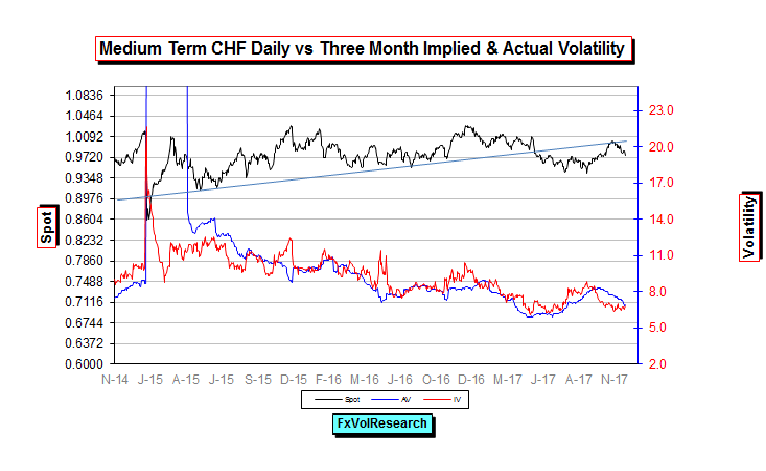
USDCHF implied vols also are starting to rise in tandem with the weaker dollar. As you can see from the Medium Term chart above the spot topped out at the top end of the previously recorded trend line. Three months implied bottomed out at 6.5 and now are only very marginally higher but the spread with the actuals has moved from being in negative territory to being bang in line with the actuals. Should the dollar decline further implied – less actual spread should move into positive territory. In our view for both the EUR and the CHF, the three month part of the curve represents the best value.
In line with the trends in the rest of the G-10 majors, short term actual vol rose sharply on Friday with two week AV closing well over the six-week measure. The news was in reaction to the news that former National Security Advisor Michael Flynn had agreed to cooperate fully with the Mueller investigation. This triggered a sharp short-term sell-off in equities that was later reduced sharply by the prospect of the Senate passing the coveted tax cuts legislation.
The risk-off sentiment may well shift to a more positive tone on Monday should stocks regain their footing. In our view, if the tax cut legislation remains in its current form, will largely lead to a validation of current equity market levels, but will not have positive long-term implications for the US economy. In fact, as we have pointed out here before, they will not significantly enhance US productivity, nor will they address the US savings/consumption imbalance. This imbalance is the reason why the US needs to fund the deficit on the current account. We remain long the three months 9950/9650 CHF call spread.
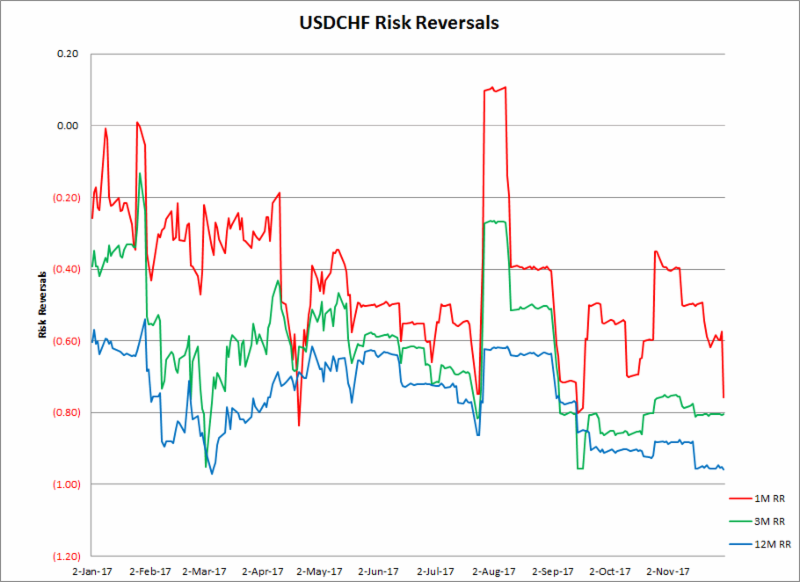
In line with Friday’s dollar weakness, one month CHF risk reversal moved better bid for CHF calls (US puts) but are still below their previous lows for the year. Meanwhile, the 3M and 12M reversals remained stable in comparison but they too have been slowly ratcheting lower over the year with the one year near to making a new YTD low.
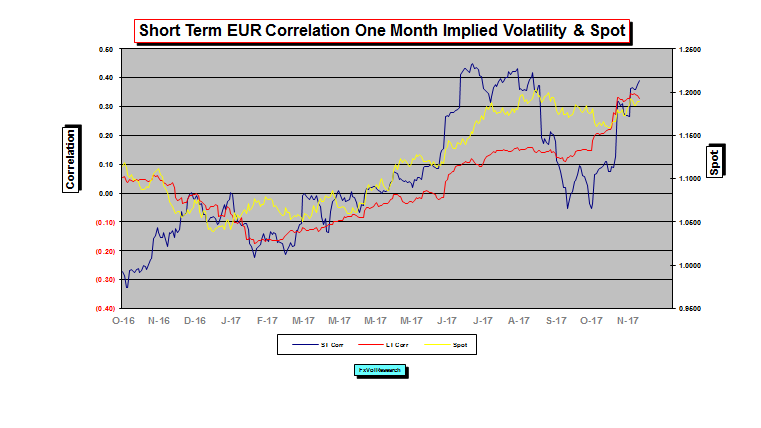
The short-term correlation of one month implied volatility and spot is in some cases a good indication of both direction and market positioning. The ST correlation is now nearly back to the previous high and suggests that a retest of the previous EUR high at 1.2090 is likely.
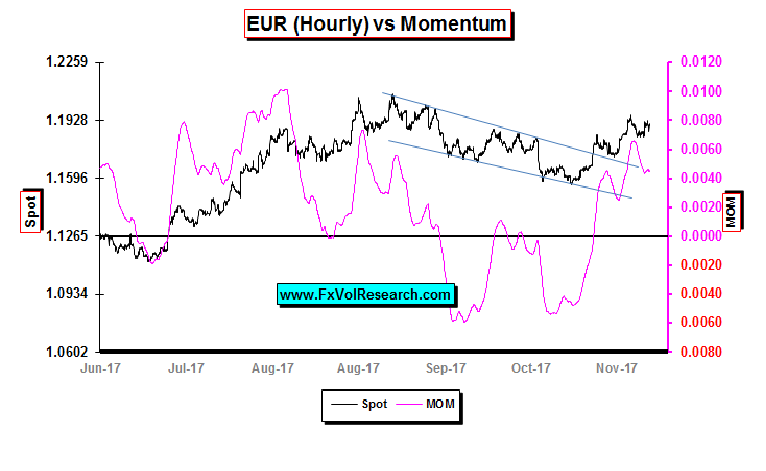
The EUR holds the hourly trend line and there is not sign yet of any divergence with momentum.
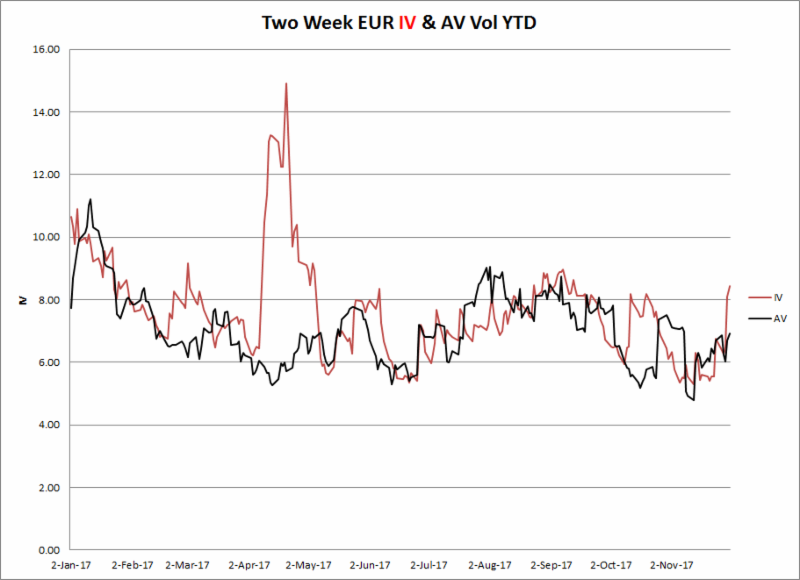
A fortnight ago we pointed out that the 2-week EUR implied were too low in relation to the actuals. This proved to be correct and now the short term IV-AV spreads moved back into positive territory. The two week IV bottomed out (mid-market) at 5.5% and closed on Friday at 8.4 (mid).
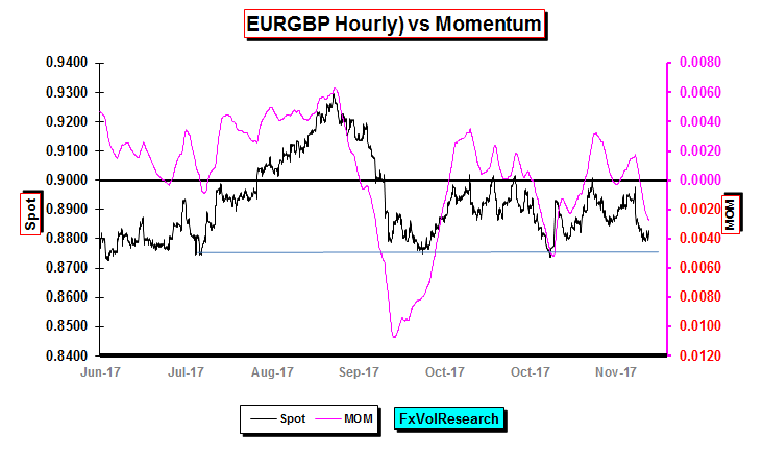
EURGBP remains choppy in the 8745-9020 price range.
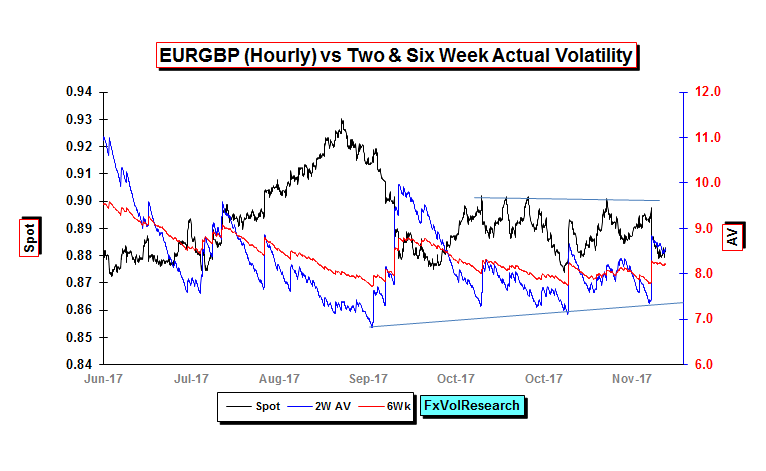
While choppy EURGBP actuals have been slowly trending higher.
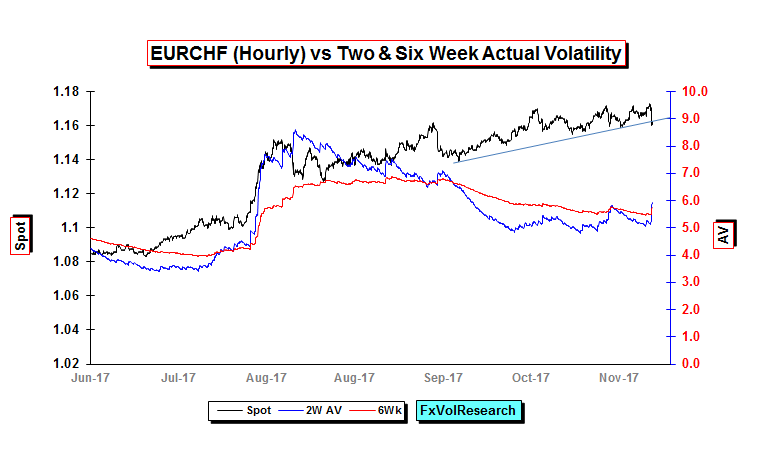
EURCHF actuals moved higher on the basis of Friday’s risk-off sentiment. EURCHF is threatening to take out the hourly trend line. Short term two weeks AV closed above the 6wk.
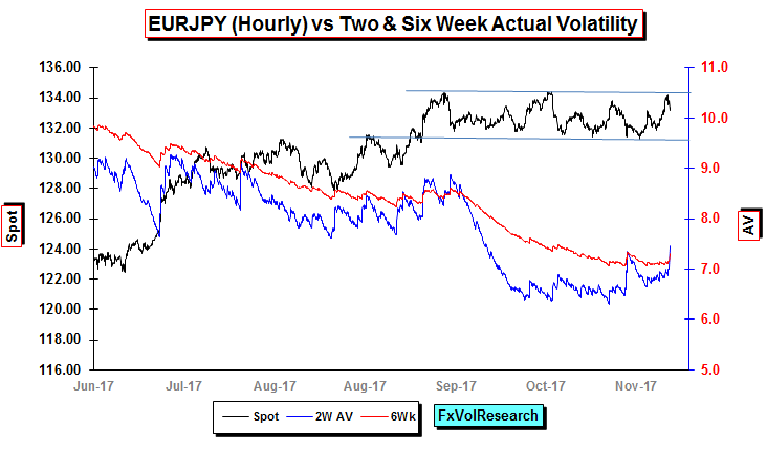
On Friday we also got a rise in EURJPY actuals for the first time since Sept. At the same time EURJPY has remained constrained by the channel price action in the chart above. If we do move into a risk-off trading environment, particularly in the backdrop of a potential US governmental crisis then all of the JPY crosses will be under downward pressure: EURJPY, GBPJPY, and CADJPY.
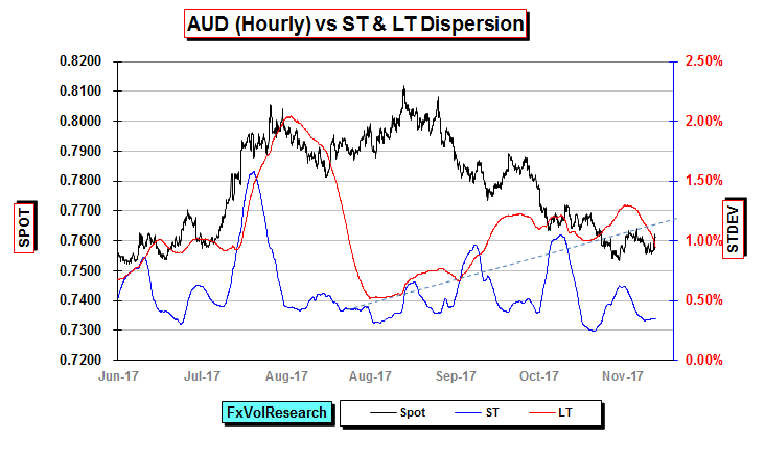
There may now be some good reasons for the AUD to bottom and start to consolidate into the New year. A six month 5 big figure decline in the AUD is par for the course when we look at price action going back to 1989. The break in the LT Dispersion (shown above) indicates that the trending price action should be diminishing.
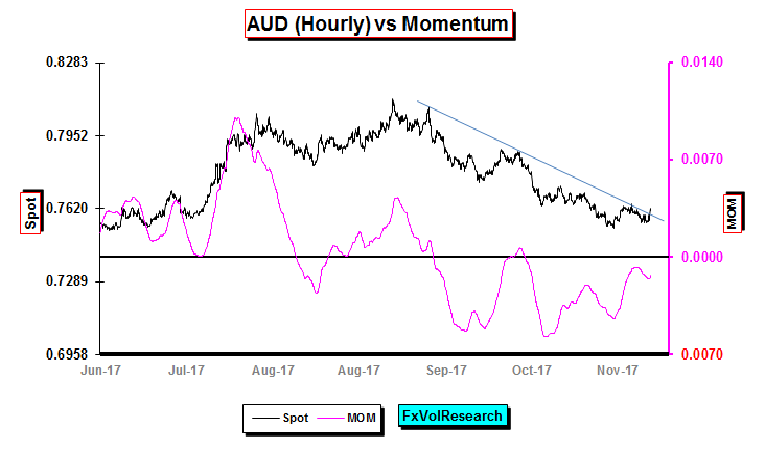
AUD is also close to taking out the LT downtrend, while momentum is close to flat. The risk to the AUD and CAD would be a collapse in the commodity price complex, and at there does not seem to be any sign of that on the near-term horizon. The RBA is unlikely to try to talk the AUD lower given their success at moderating the risk when we got over 80cents.
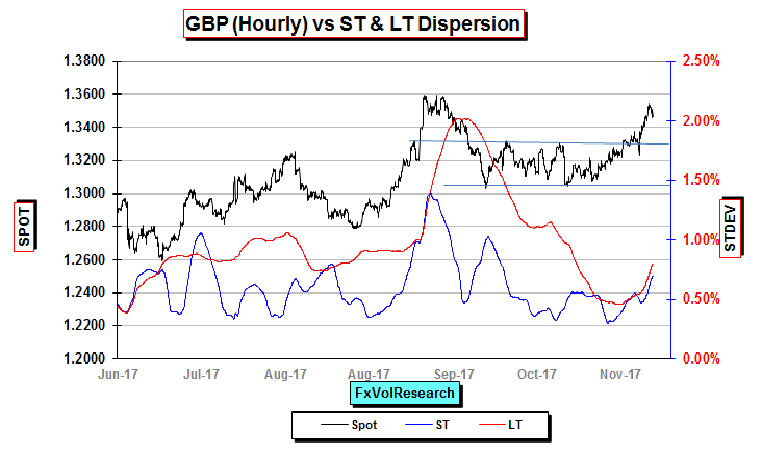
GBP has taken out the channel price action. So do we fasten our seat belts for a re-test of 1.4000? The good news in the near term is the expectation that the divorce bill the UK has to pay to the EU is near or close to being agreed. Similar optimism surrounds the remaining question of the border between N. Ireland and the Republic.
Tory hardliners are towing the line because in the near term they are getting what they want while they fear the possibility of the May government falling and a new election being called. Even if these hurdles are overcome, what still needs to be resolved is the much larger issue of the UK’s future trading relationship with the EU.
There are basically two models one is the CAD-EU free trade agreement, and the other is the Norway model. The UK will want a bespoke deal with the EU-27. They will not get it because they just don’t have a tenable negotiating position. The Norway model will not be acceptable because it implies free movement. So the only real option is one that is along the lines of the CAD-EUR trade agreement, which covers goods but not services.
Given the wide differences between the two parties, these negotiations will be far longer and far more onerous than the ones so far. If GBP can take out `1.3600 then a re-test of 1.4000 becomes probable, and at that level, it may well start to look much more vulnerable particularly if it takes place within the backdrop of deteriorating UK fundamentals.
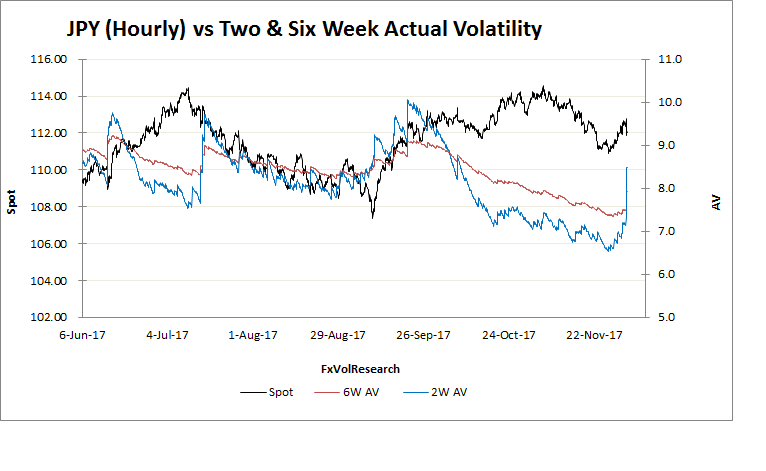
Not to be left out the Yen actuals also rose on the back of the Mueller news. Yen momentum remains in negative territory. As we wrote last week a modest correction in the Dollar would not be amiss in the wider context of a gradually weaker dollar in the medium term.
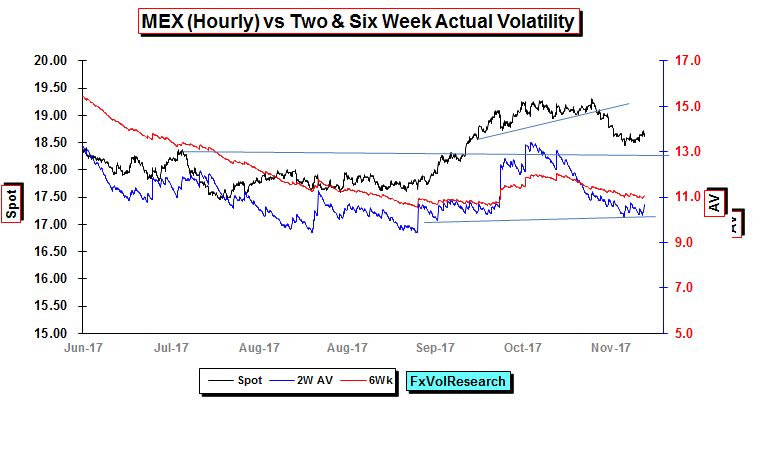
The MXP did not participate in the general rise in FX actual vol last week. If you are a natural seller of US calls the opportunity to sell 25 delta risk reversals as a hedge and earn something in the region of 4 vols is slipping away. This will take advantage of both the US-MXP interest rate differential and the high skew.
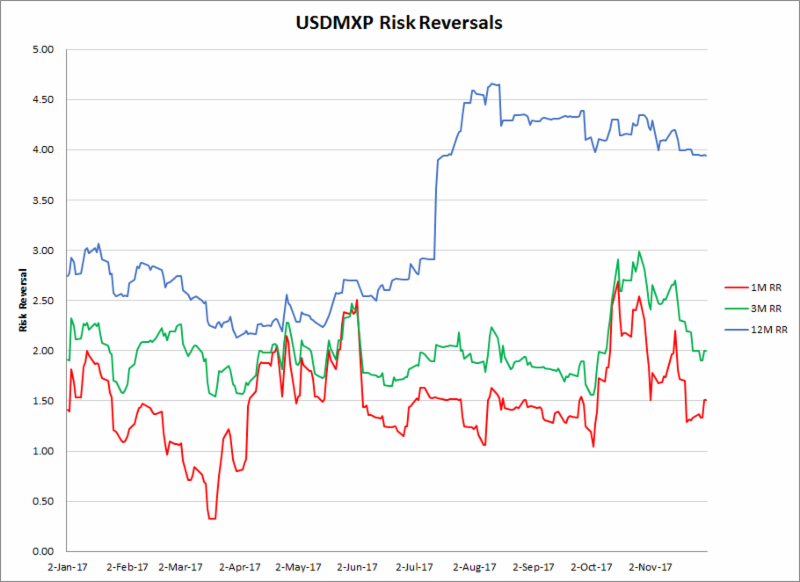
MXP risk reversal continues to trend lower as the premium for US calls declines.
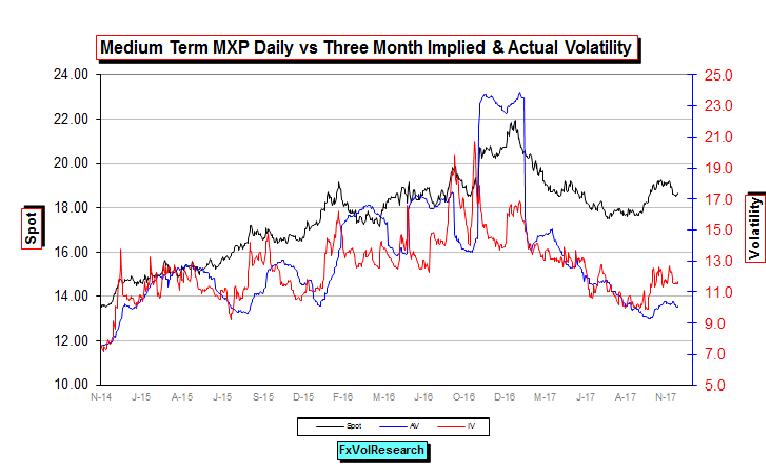
The MXP curve is also showing signs of being expensive on an IV-AV basis. This is not surprising given the event risk of the NAFTA negotiations and the upcoming Mexican general election.
Source: James Rider – http://bit.ly/2A1Dz8B


