
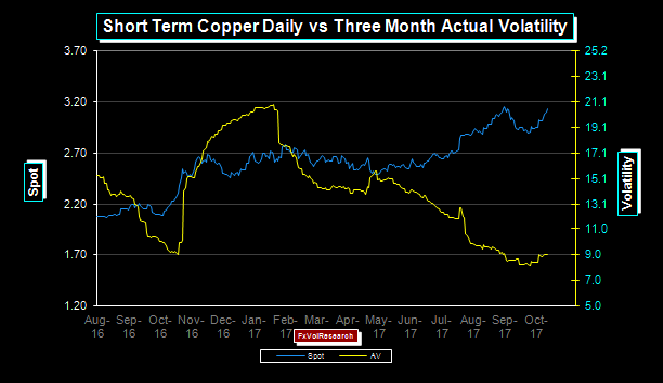
This was a good week for the commodity space. Copper is nearing its previous peak and may take out the old high. If it fails it may set up the possibility of a double top. Actual vol is also failing as copper rises. This is also true of the more generalized DJ Commodity Index, which last week took out the old high of 690, also with declining actual vol.
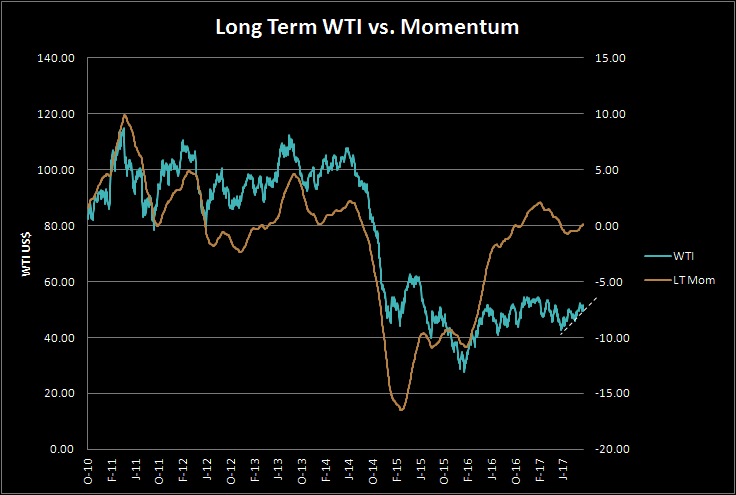
The decertification of the Iran deal by Trump, potentially could impact the oil market if the US Congress were to reimpose sanctions on Iran. This is unlikely. The oil market is still largely consolidating is a broad 43-55 dollar range and even though LT momentum is turning, WTI still faces substantial topside resistance in the 52-55 dollar range.
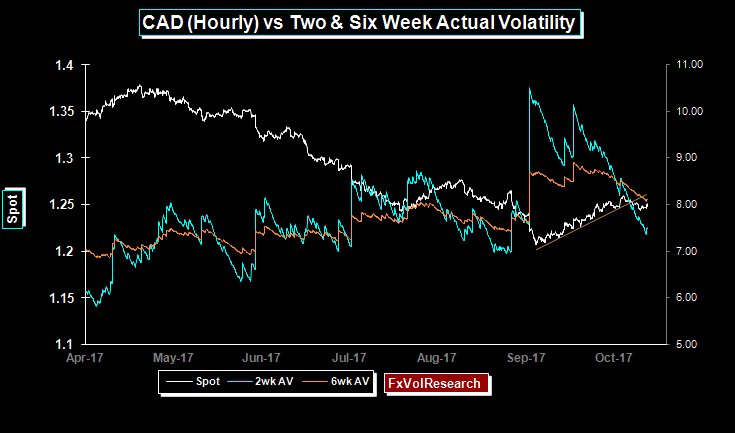
In keeping with the generalized sell of in vols, short-term C$ actual vols fell sharply on the week, with the two week testing just above the 7% level. This is very much in line with the change in the premium levels in the options market. One month vol under 7% still looks a bit too cheap. The three months implied vol ended just under 7% and now looks to test important support at the 6% level.
Risk reversals in CAD ended the week mixed. The one year nudged slightly lower in term of premiums for $ calls, while the one and three months ended the week largely unchanged. CAD also took out the very short term trend line (as seen in the chart above). C$ momentum is still holding in US$ positive territory but it is fading. Both short and longer term dispersion indicators are rolling over.
The NAFTA negotiations, which obviously have impacted the MXP, have not shown up so far in the CAD trading. This may be a sign of complacency and would be a reason to maintain net long gamma positions. The market may well be assuming if NAFTA is scrapped, that Canada will revert to the old FTA negotiated by the Mulroney government; or that Canada will accept a bilateral US-CAD agreement.
In the short term, the resumption of cross-border tariffs between CAD and the US will be inflationary, particularly in the area of consumer staples. No doubt this would be a short-term shock to the economy. Food prices could rise while the economy stalls.
Longer term prospects may well be better. While the US administration insists on bilateral-only trade agreements, Canada has remained more focused on negotiating multi-lateral trade deals. With CEDA and the revival of the trans-pacific trade deal without the US, longer-term, Canada could potentially be well positioned to exploit a wider array of trading partners in a way the US cannot, given the US growing protectionism.
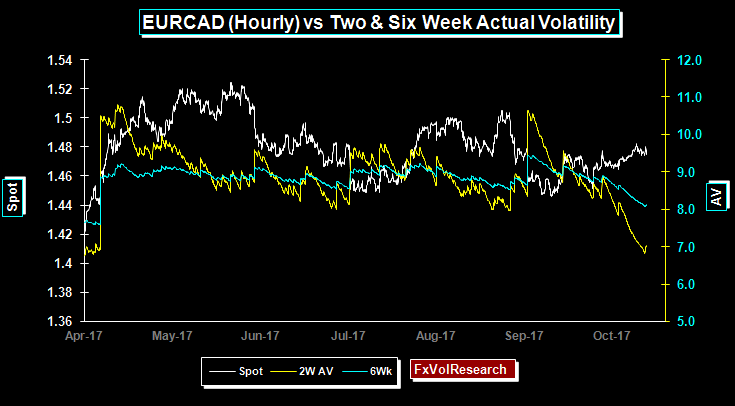
EUR/CAD actuals fell last week with the two week finding support at the 7% level. Dispersion is also falling, with both short and LT measures close to important cyclical lows. The upshot of these indicators is that the broad consolidation of EURCAD between 1.5000 and 1.4500 may not have much further to run and increases the probability of a larger break out. As you can see from the chart below EURCAD is testing the years low of just over 7% and that level should provide important near term support.
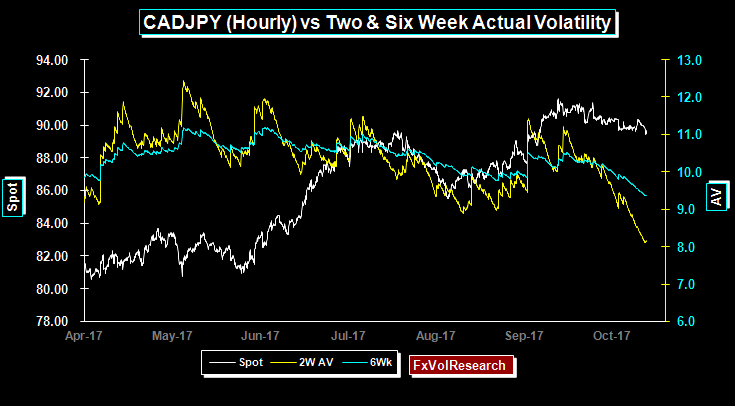
CADJPY vols also fell on the week along with the dispersion readings, but not to the same extent as we noted above in EURCAD. CADJPY is still holding below the hourly trendline, while momentum remains mildly negative. Two week CADJPY implieds are well bid over the actuals ahead of the Japanese elections.
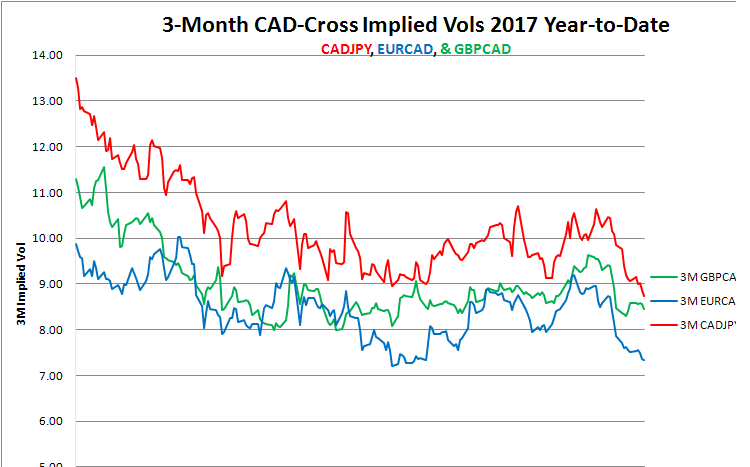
Three month CADJPY implied vol making new lows for the year, with EURCAD testing support just over the 7% level.
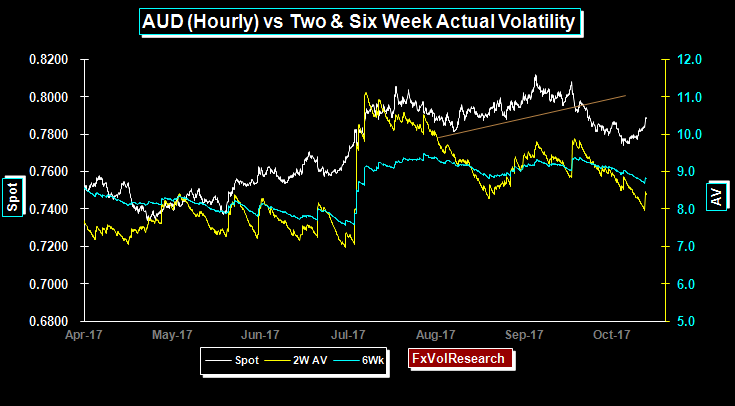
AUD found support from the commodity complex in general with the support from iron ore prices in particular. Nevertheless, the spot remains well below the hourly trend line support and while momentum is recovering from its lows, it remains in negative territory.
Risk reversals moved higher (lower premium for AUD puts) and in particular, the one year traded at a new high. Both six-month and one year AUD implied vols are starting to move into the fair value to cheap territory but they can still move lower as the spot remains above 78 and below 80.
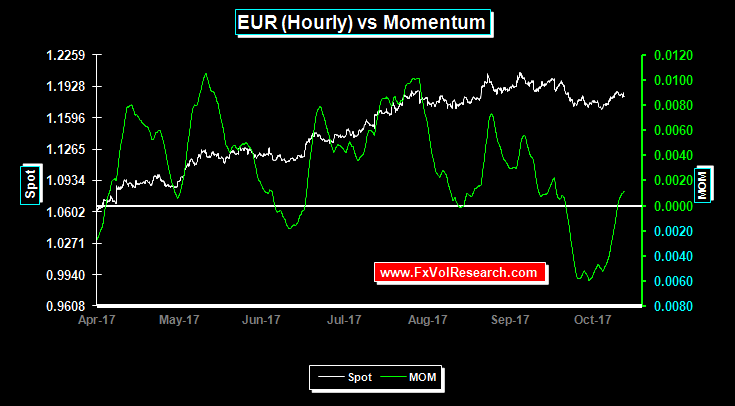
The EUR is still holding below the hourly trendline, however momentum has now flipped into positive territory. Both one and three month EUR risk reversal moved slightly better bid for EUR calls, while the one year EUR risk reversal moved slightly lower. There remains fairly consistent demand at least in the front end of the curve for out-of-the money EUR calls.
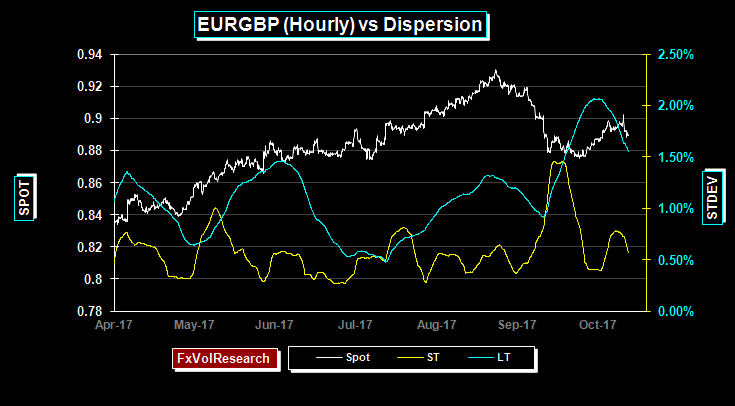
EURGBP has taken out the hourly trendline in the chart above. With dispersion rolling over this increases the chances of EURGBP consolidation in the 88-90 range. Momentum remains in EUR positive territory but is declining. A weekly close over 90 would in our view re-establish the long-term EUR uptrend.
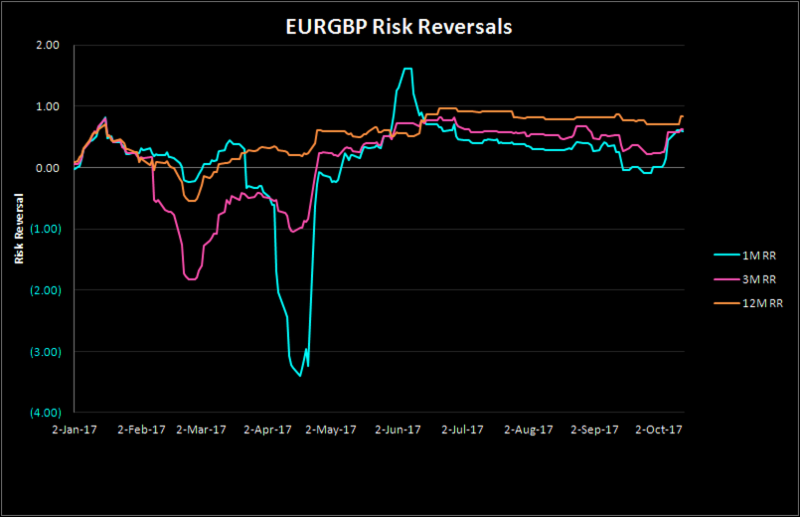
Front end and one year EURGBP risk reversals moved better bid for EUR calls over GBP and are not far off their most recent cyclical highs. EURGBP risk reversals are only moderately expensive in terms of our percentile rank indicators and can go higher from here. A retest of the 1% level in the one year (the previous 2017 high) is likely.
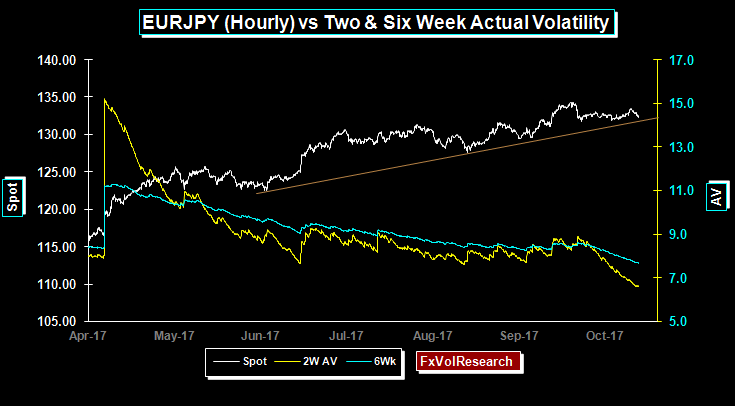
EURJPY holds the hourly trendline while both actual & implied vols decline. Three month EURJPY implied vols are likely to re-test the 8% level.
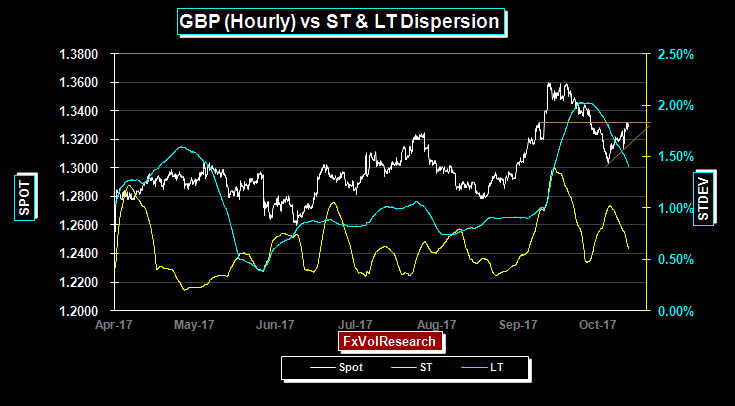
GBPUSD is one of the few currencies in which 2-week actuals are now over the six weeks. The spot retracement on Friday came in response the signs that the EU may be more willing to accept a two-year extension of the article 50 beyond the deadline.
This is the key issue facing GBP in the near term and should the bulk of May’s cabinet fall into line on this issue it will make her premiership a bit more tenable, and it may well start to put Brexit into the background. Despite the rally on Friday, momentum indicators remain bearish.
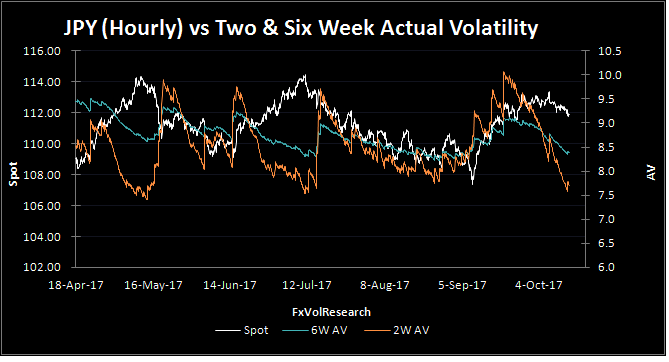
Actual vol and the premium levels fell over the week with the exception of the two weeks which firmed up ahead of the upcoming Japanese election. Two week implieds are well bid over the actuals. If you want to take a punt on the election outcome, the better value is to own the one month.
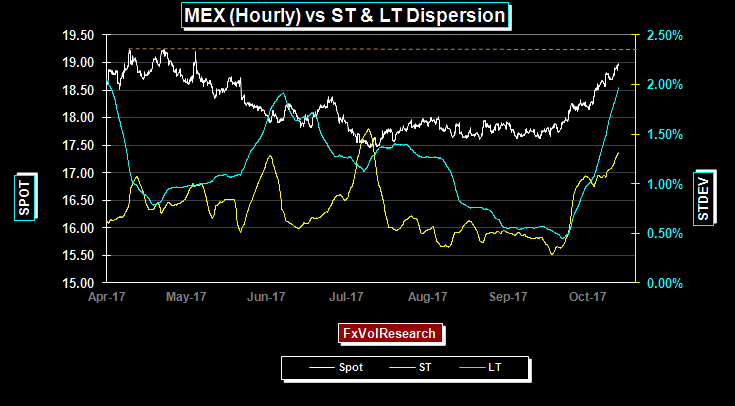
The peso continues to weaken. We pointed out here on several occasions that MXP dispersion indicators were low and unsustainable. At the same time, our ranking of MXP implied vols have been undervalued for some time & solidly in the buy zone. The NAFTA talks along with the potential fallout from the upcoming Mexican elections are the primary backdrop to the move. The next resistance is around 19.25 shown in the chart above.
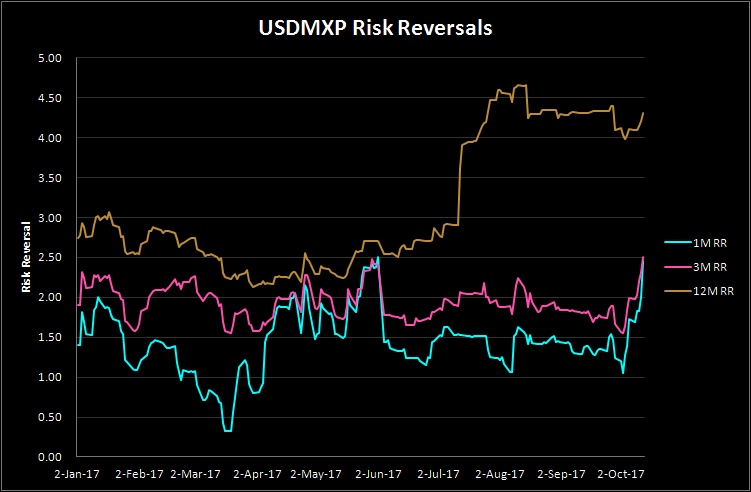
MXP risk reversals are not surprisingly better bid for calls. Both the one and three months are testing their highs for the year, however, the one year, while higher still has not yet taken out the previous yearly highs.
Source: James Rider – http://bit.ly/2yma4g8


