

After a good run, the AUD seems to be losing topside momentum. The commodity bloc is leveraged to the global reflation trade and while there is some evidence of a synchronized global recovery, the macro signals in terms of commodity prices remain weak. The commodity complex is still very dependent on China’s debt fuelled recovery and the ability of the authorities to navigate a rebalancing of the economy away from exports toward consumption. Commodity prices are only modestly firmer. A sustained rally in the commodity bloc would gain greater traction if the demand from Chinese reflation were accelerating. The AUD rally in my view has more to do with the unwinding of speculative shorts rather than a renewed acceleration of the global reflation trade. The AUD shorts have been working on the premise of a sharp deceleration in Chinese growth, and so far it’s just not showing up in the numbers. The most likely catalyst though would be serious deterioration in US-Chinese relations generated by the unilateral implementation of US tariffs. If that were to happen, it may well trigger a re-establishment of fresh long term AUD shorts.

The Vortex indicator using hourly data has gone short the AUD (red line crossing above the blue) based on Friday’s closing prices. As you can see from the chart the previous indicator highly profitable, however, prior to that, the track record is choppy based on hourly data. Using monthly data long term Vortex indicators for a number of major currency pairs have gone short the dollar. This has occurred in the following pairs: AUD, CAD, EUR, CHF, and in EURCHF (long EUR). However, these signals need to be taken with a pinch of salt and need to be interpreted in conjunction with other technical and statistical analyses.

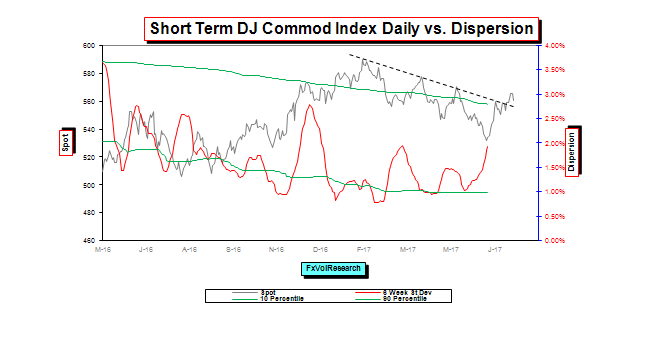
Canadian dispersion readings are showing the first tentative hints of trend exhaustion as the ST and LT indicators are starting to roll over from recent highs. The probability of a meaningful correction in the USDCAD is high. Thre is sufficient evidence to warrant limited loss option based trades, that will profit from a correction and decline in implied volatility.

Looking at daily data in the chart above we see fewer signs of trend exhaustion but it is important to note the local cyclical high in the dispersion readings. Looking at LT vortex indicator readings using monthly data does suggest we have moved into a bear market for USD-CAD (same is true for AUD as noted above). However, even if this proves true, it does not rule out the high probability of a strong counter-trend trade back to 1.3000.

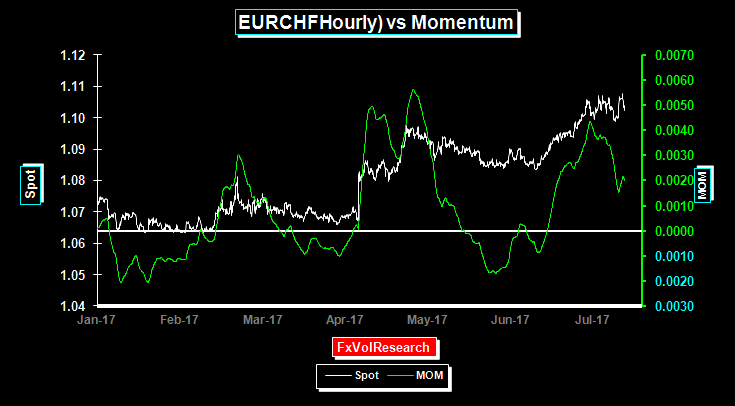
Momentum turns up at the end of the week implying at minimum that the USDCAD sell off is losing steam.

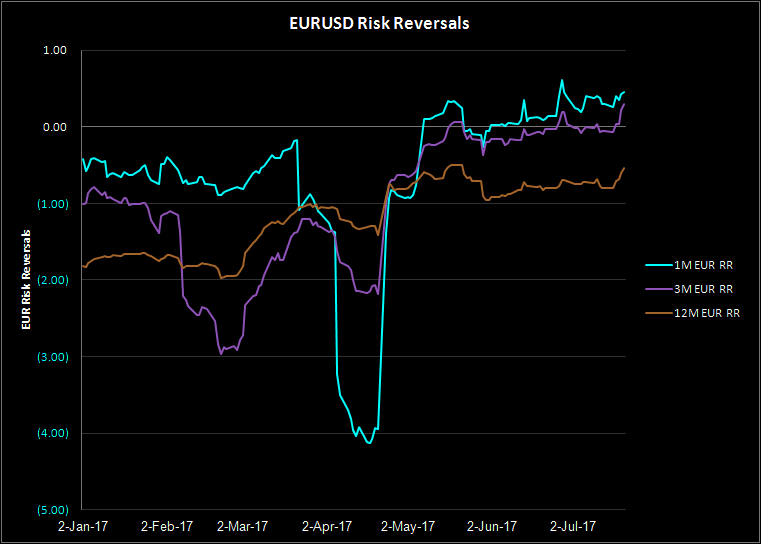
Despite the sharp & sustained CAD rally, one month CAD risk reversals have not gone bid for CAD calls. The rest of the curve contineus to lose the premium for USD$ calls.

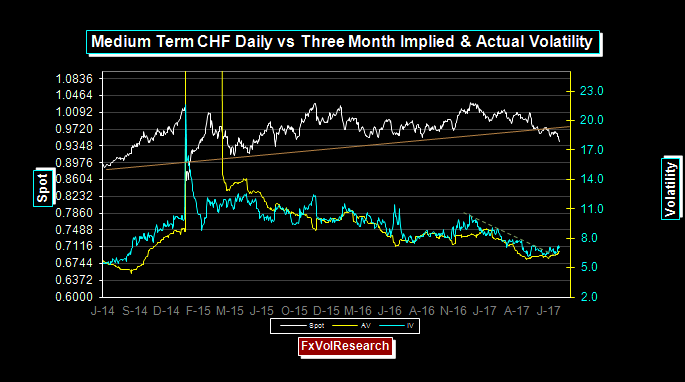
ST spot vol correlation continues to correct from its most recent extremes. This combined with the turn in the disperison indicators implies that the trend is very close to exhaustion. The trade we highlighted last week for DEC expiration, namely, buying the 81-76-71 Put butterfly should now be implemented The trade is long 1X the 81Put short 2X the 76 Put and long 1X the 71 puts all for DEC expiration. Look to unwind on a move back to 6% in the vols or a move back to the short strike (76 cents or 1.3157).

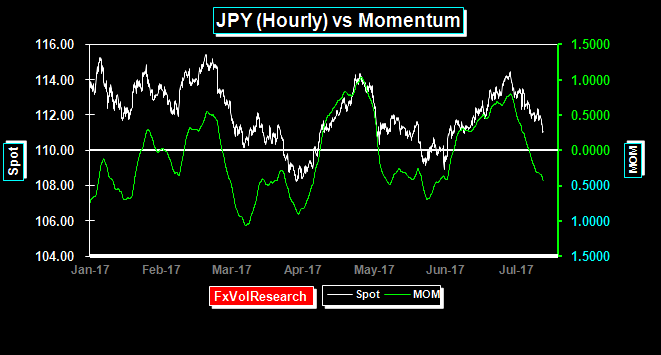
CADJPY is showing signs of trend exhaustion. This is consistent with the USDCAD momentum exhaustion readings above and the JPY momentum chart below.


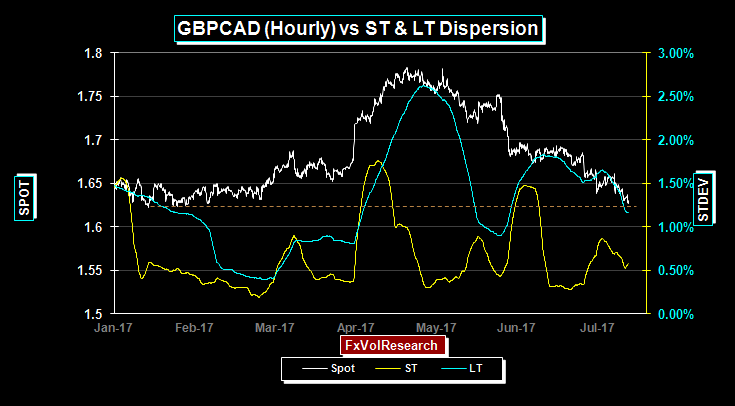 Dispersion falling as GBPCAD testing 1.6300.