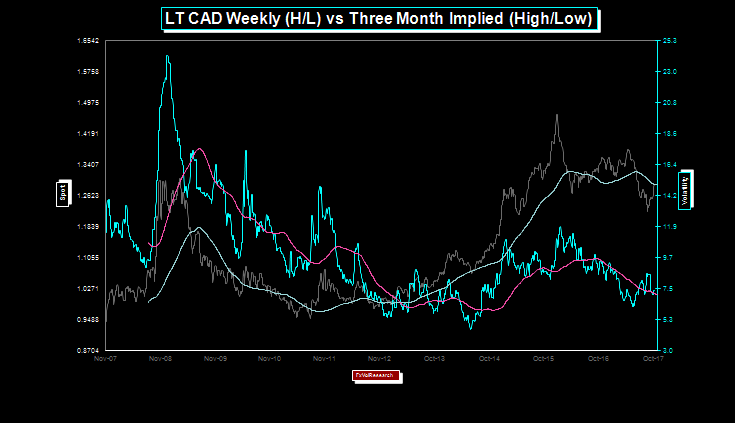
The chart above is ten years of daily spot CAD data in grey overlaid with 3-month CAD implied volatility in blue. The purple & grey lines are the 200 day moving averages on both. With Friday’s price action the CAD dollar is now back in line with the 200D daily moving average, and the same can be said for the 200 day moving average on 3-Month CAD implied volatility.
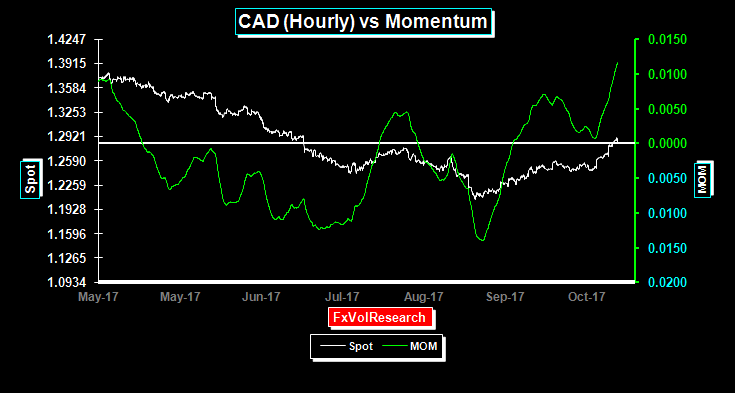
CAD momentum turned higher on the price action from Friday. Longer term momentum indicators using daily data are also showing the first signs of turning up in favour of the Dollar (not shown).
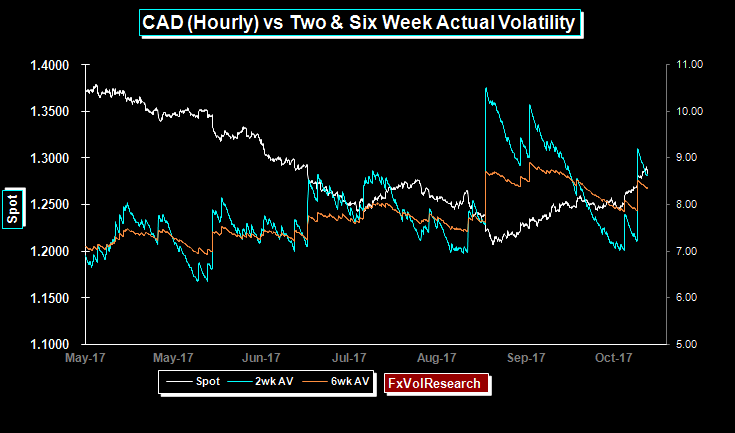
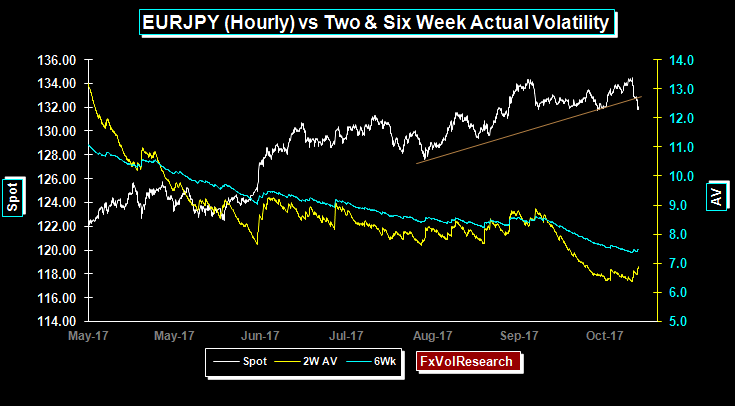
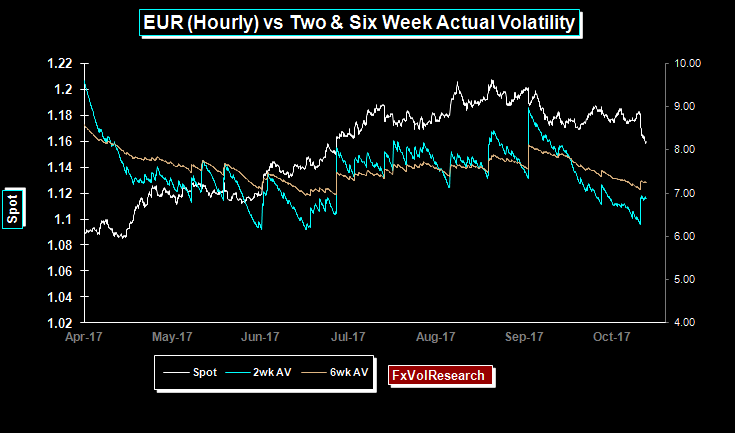
Not surprisingly the body of the CAD implied vol curve moved roughly a quarter of a point higher, however, the one month under 7% remains a good buy particularly if you are short the 3M-6M periods. Friday’s price action as you can see from the chart above puts the two week realized vols back up to 9% and the six week over 8%. Lots of edge for skilled gamma hedging.
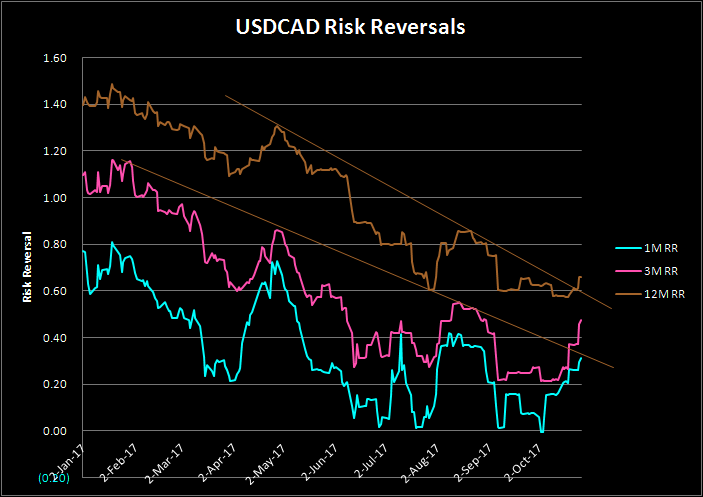
Risk reversals which as you can see from the chart above, have been trending lower from the start of 2017, but again Friday’s price action has broken the downtrend in the 3M and 12M periods.
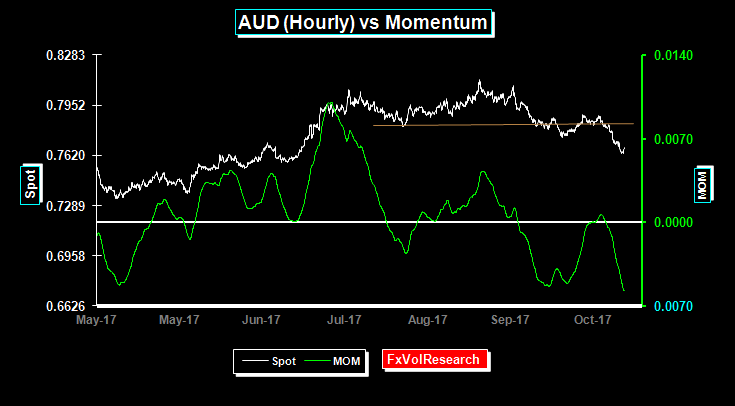
AUD momentum flipped back into negative territory over the week. AUD realized vol did not rise at the same time, implying that the market is not short of downside options. AUD risk reversals also hardly moved on the week another indication that the market is not overly short AUD puts.
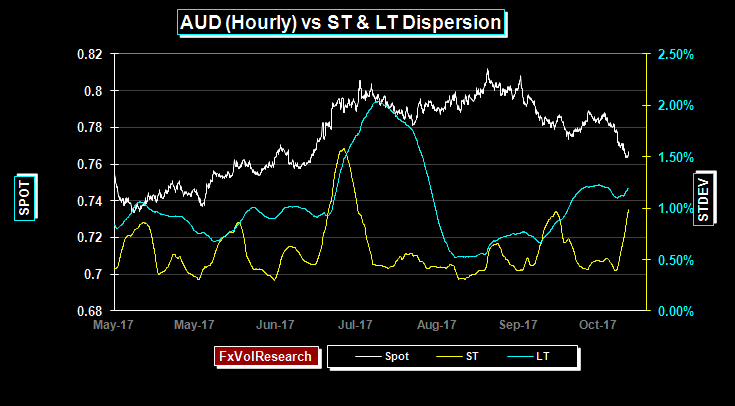
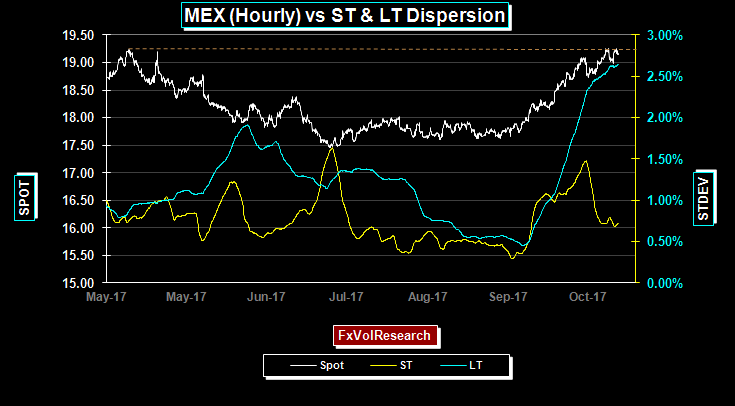
Short and LT dispersion continues to rise implying that the existing downtrend in still intact. However as we noted above other indicators suggest a more corrective rather than an impulsive move lower. This price action may well persist on a gradual decline back to 7500. A break lower from 7500 would likely trigger both a sharp rise in realized vol and the AUD risk reversals.
The body of the AUD curve only ended the week slightly higher. The one year is now bid over 9% and we continue to see value there under the 9% level. Short dates ended the week bid ahead of next weeks important US fundamental releases.
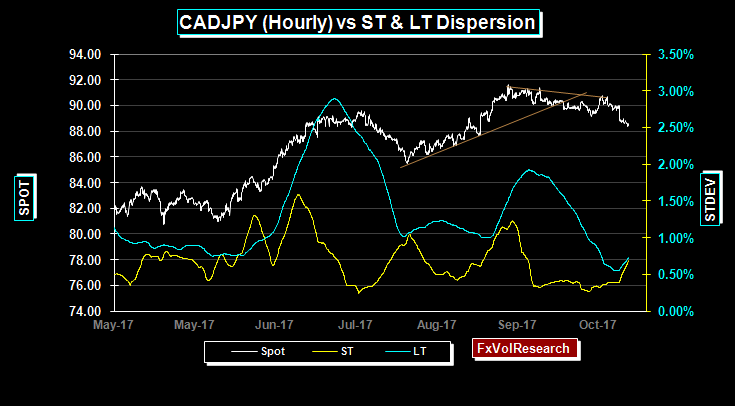
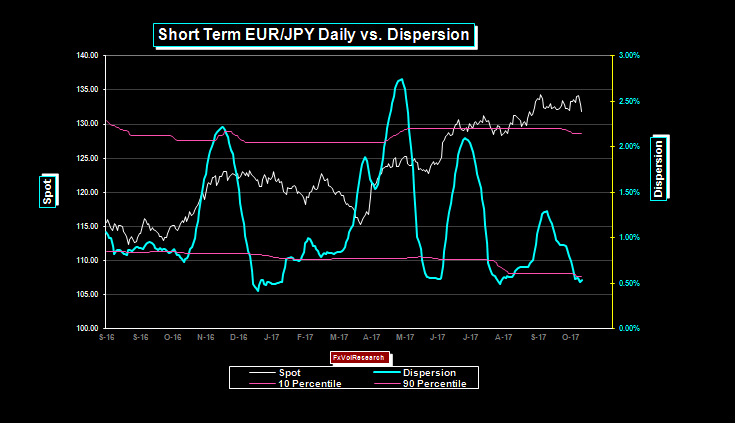
We continue to see the potential for a more sustained directional trend emerging in CADJPY with both ST and LT dispersion turning up at the same time. The dispersion indicator is agnostic on direction, but in our view the odds of a sustained move toward a weaker CAD, stronger yen are our preferred view.
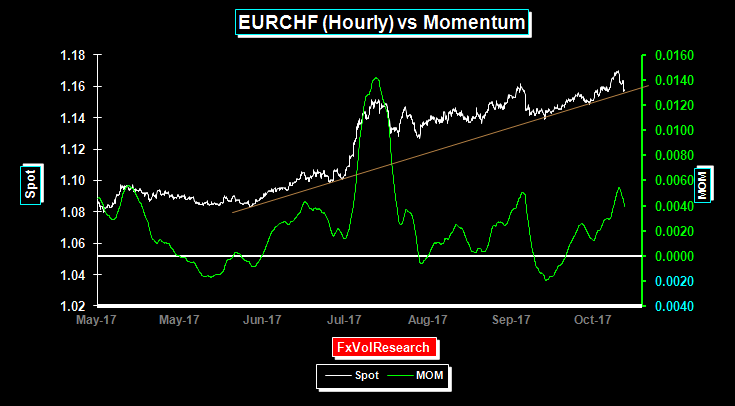
EURCHF remains in a steady uptrend with moderately rising momentum but the trend line is being tested.
Similar to our AUD comment above, the EUR is correcting lower but with realized vol readings remaining low. Now that we have taken out the 1.1690 area a larger correction is likely, suggesting a medium-term move back to the previous area of consolidation in the 1.1200/1.1300 zone. Directional indicators using our version of the Vortex indicator have also turned bearish for the EUR. The same can be said for CAD, AUD, and to a lesser extent to GBP. With US rates likely to rise again in DEC and following on from ECB Draghi’s dovish withdrawal of bond buying, combined with the separatist developments in Spain, the table seems set for a sustained dollar to move higher.
Having said that, however, this move lower in the EUR is likely to end up being a healthy correction in a more secular Dollar bearish move. The ECB seems to have decided to run the economy hot. Further delays in raising interest rates only mean that when the interest rate turn comes, the ECB will have to move faster than expected. Under this scenario, the EUR weakness that we may well see in the short term will likely be followed by a sharp EUR snapback higher next year.
The market seems to buy into the view that the Trump administration will be able to navigate comprehensive tax reform before by the end of the year. Given the emerging divisions between the Administration and the Senate, this is view is naive. At best the Administration will be able to enact some tax cuts which will end up being deficit-financed.
The consequence will be a short-lived consumption driven sugar rush but the long-term effects will not address the US savings-investment imbalance and will end up simply reinforcing the deterioration in the current account. For the dollar, the longer term net effect will be negative.
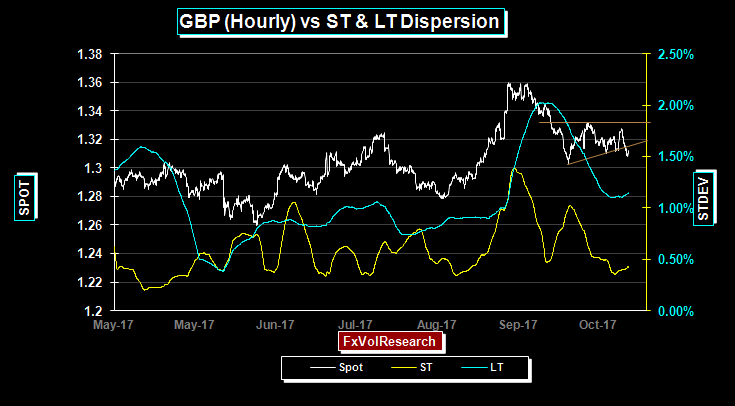
Longer term directional volatility based indicators have also turned slightly bearish on GBP. Even if expectations are met and the BoE removes its 25bp cut following the Brexit vote, that may not be enough to sustain GBP in the medium term. The BoE will likely justify any upward move in the context of rising global interest rates, and less on developments in the domestic economy.
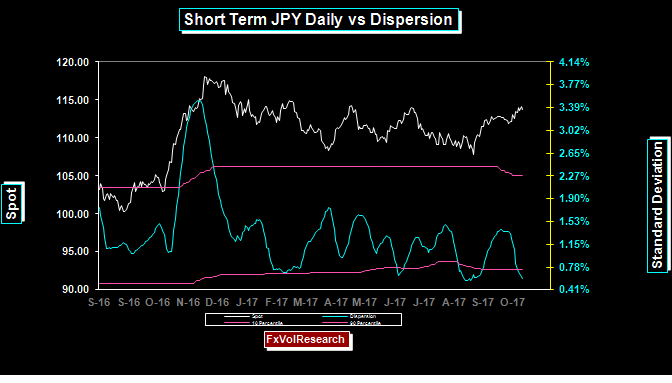
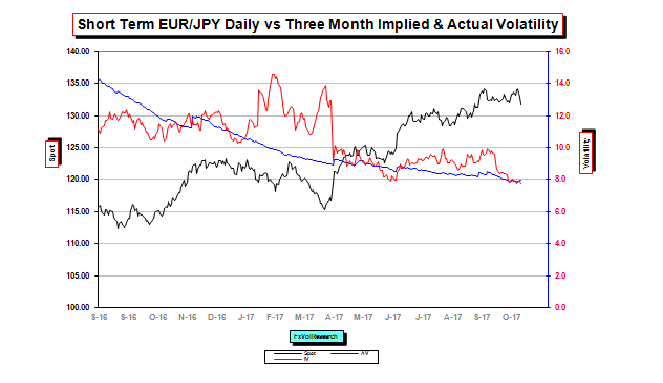
The yen continues to consolidate in a wide trend zig zag fashion, finding support at the 107/108 and topside at 113/114. Dispersion once again is low and a break out from the consolidation patter is likely; a move back to the the previous low around 107/108 or, finally a break higher above 114 seems likely.
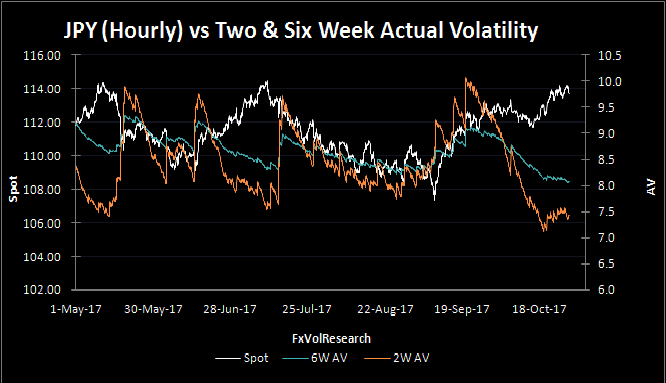
Yen actual remain low and are testing previous lows for the year. Unfortunately the premium level in the short dates options are not following the actuals lower, so implied less actual spreads are well into positive territory. This is not surprizing given the full plate of economic releases next week.
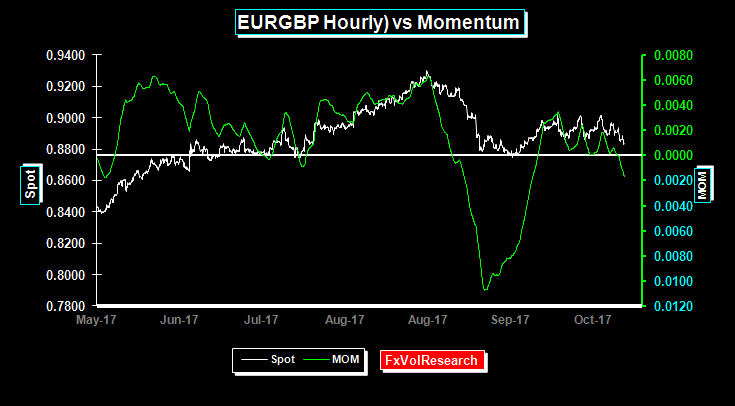
EURGBP momentum has moved lower and now is marginally in negative territory. One the downside the 88 level remains key.
EURJPY dispersion is also low using daily data.