
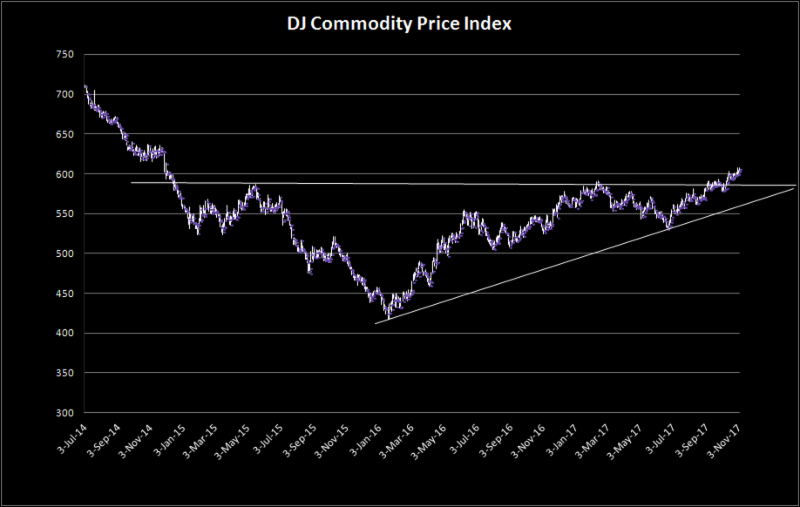
The melt-up in the commodity complex as represented by the DJ Commodity Index is breaking key topside resistance levels.
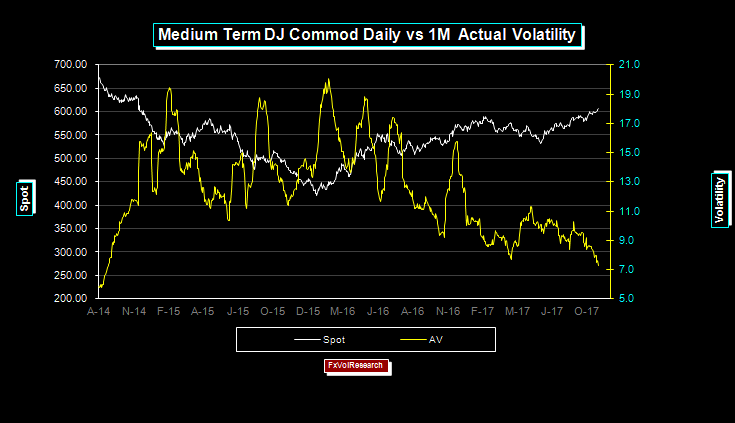
Above is a 3YR+ chart of the DJ Commodity price index vs. the one month realized volatility. The index is making breaking out to new highs while the actual volatility in the one month making new lows.
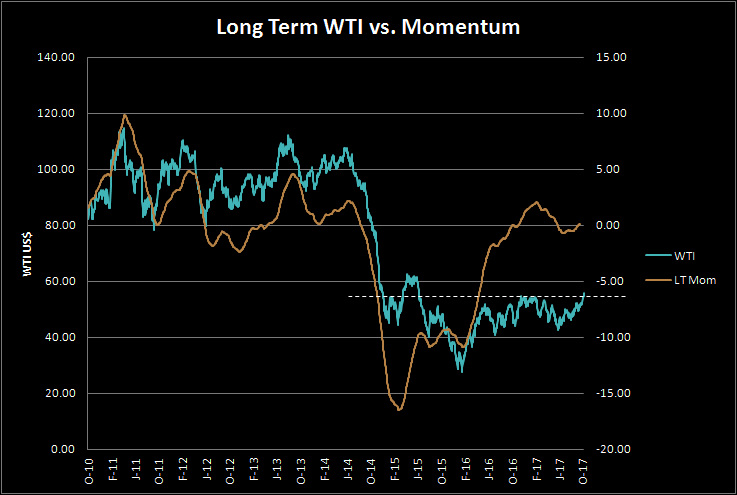
WTI is just clearing topside resistance but with a rather uninspiring rise in momentum.
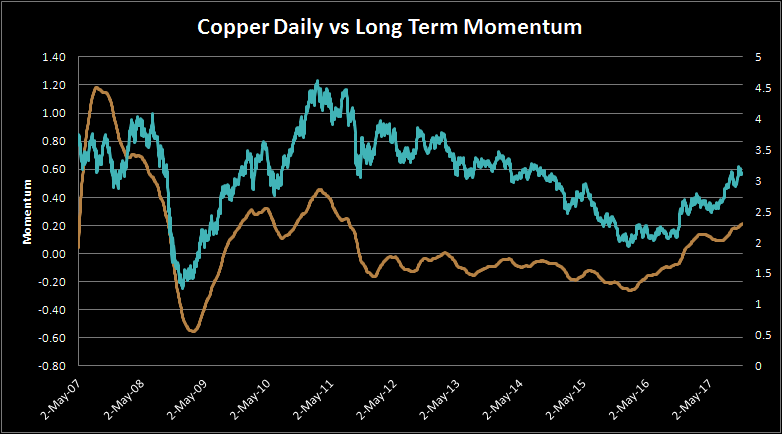
Similarly with Copper. The LT chart continues to show rising LT momentum.
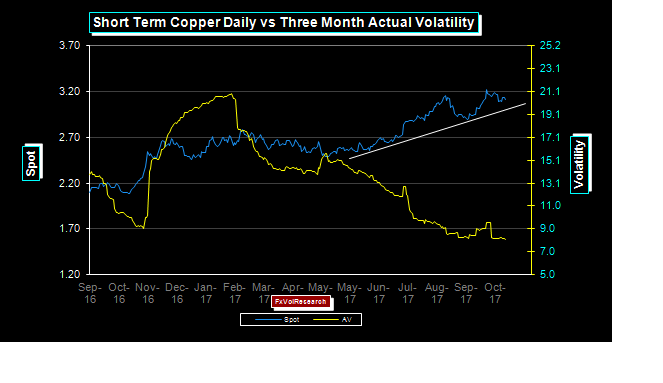
And like the broad commodity index, Copper realized volatility is now under 9%.
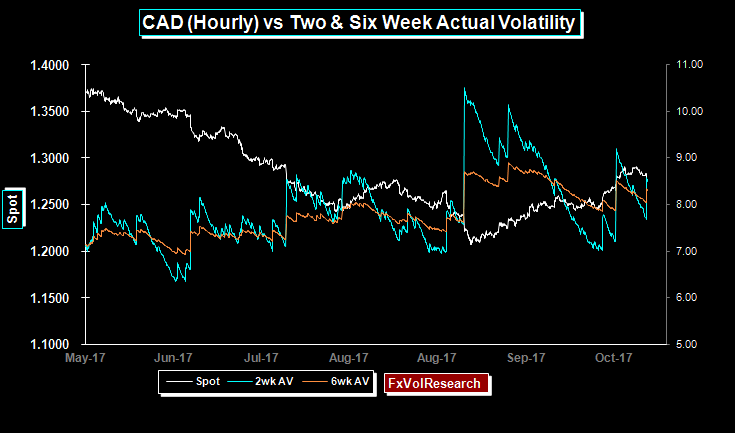
With the commodity complex showing such strong support and upside momentum, why isn’t the CAD dollar firmer? The commodity complex provides good underlying support but it is not driving movements in the AUD and CAD at the moment.
Despite the CAD jobs numbers which did show good underlying improvement in the corporate sector using year over year data, the trade numbers demonstrated a further and more pronounced deterioration in the trade balance. New restrictions mortgage credit and persistent concerns over the NAFTA talks are both significant headwinds. What is surprising is the lack of demand in the export sector given the clear evidence of synchronized global growth.
Short-term interest rates spreads are having a more sustained effect on the exchange rate now rather than commodity prices in general. The slow steady melt up in the commodity complex is mirroring the synchronized improvement in the global economy, but CAD trade activity is not participating in this upswing. On the other hand, if we get a reversal in the broad commodity price indexes it will have a sharp and material impact given the other headwinds that the Dollar bloc currencies are now facing.
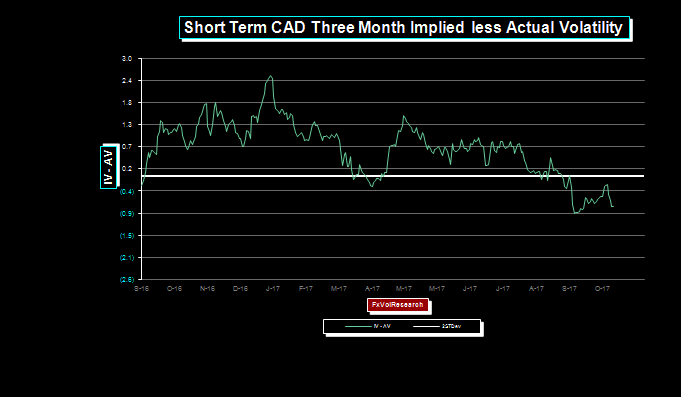
IV-AV spreads have turned negative as realized CAD vol remains is tracking over the implieds. The options market is expecting a period of consolidation and a further narrowing of trading ranges going forward. Three months CAD IV should find very good support at the 6% level. We have been advocating for some time, strategies that are short the body of the curve, and have a delta bleed that gets shorter CAD – similar to a butterfly structure. We would hedge this with some short date gamma style options when they are clearly undervalued.
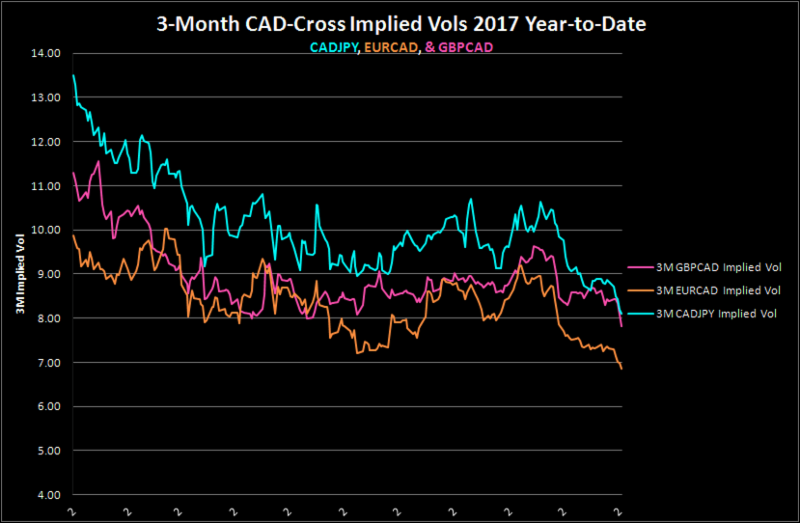
CAD – Cross vols vs the majors all made new lows this week.
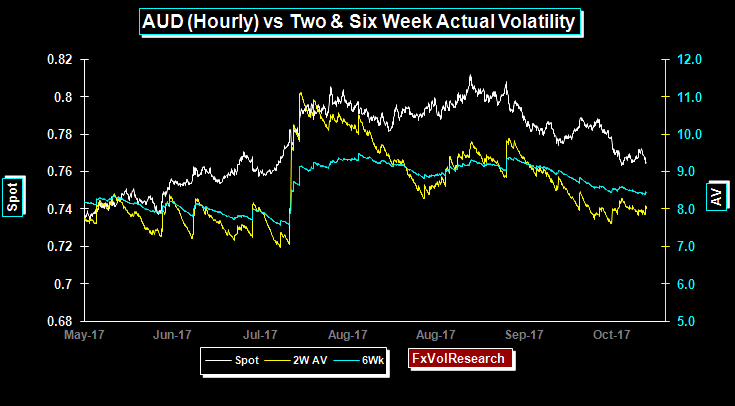
AUD like CAD is continuing its controlled decline with falling volatility. This has been a theme with regard to the AUD for some time. AUD risk reversals did not move much over the week and in our view remain cheap for AUD puts in relation to AUD calls. Weaker fundamental AUD releases, in particular, the retail sales number are overshadowing the support from the commodity complex we noted above.
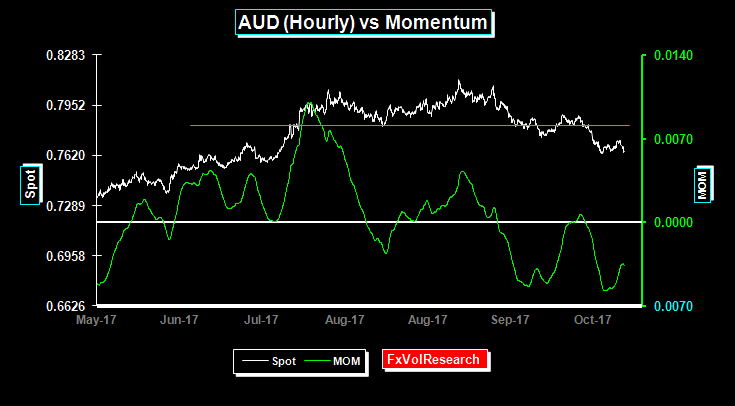
AUD momentum remains in negative territory.
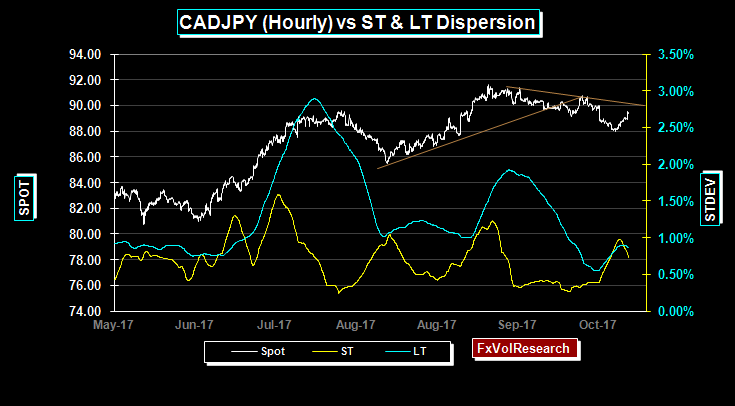
CADJPY may correct back up to the 90 level but in our view the cross could be on the verge of a larger & more sustained move lower. There are substantial short positions in the USDJPY and an unwinding of those could trigger a much sharper yen unwind of these trades.
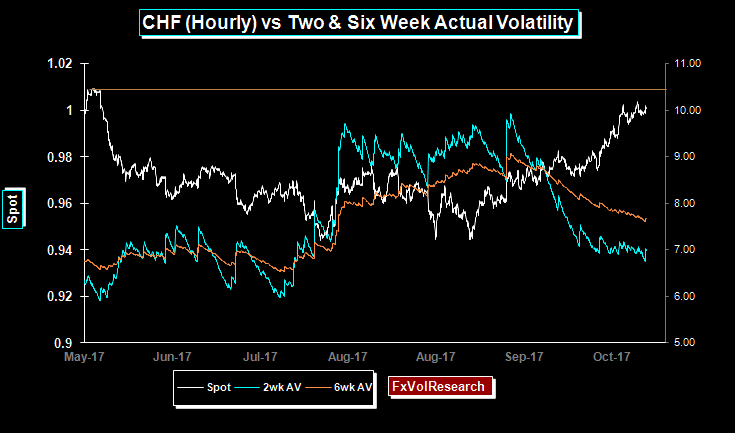
Same there with the CHF. Nice trending price action of the USD vs the CHF but with steadily declining actual vol.
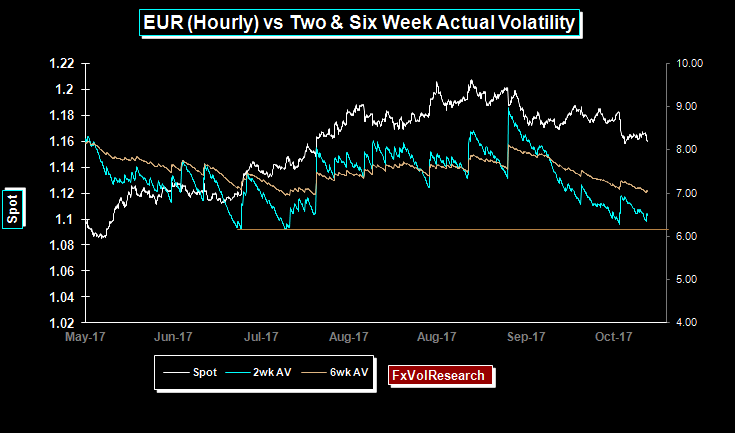
EUR actuals are testing the recent cyclical lows as you can see from the chart above. One month EUR is oversold in the mid 5% range and the rest of the EUR curve is re-testing the 2017 years lows. For the 3 Month period, this would be around the 6% level. EUR risk reversals moved very slightly better bid for EUR calls with the one year moving to flat from a very slight EUR call premium.
FX hedgers should seriously look at option-based hedging strategies at these kinds of premium levels, particularly in the EUR, and EUR-JPY and the major CAD-Crosses. EUR dispersion readings on a daily basis are also low implying a higher chance of renewed trending price action.
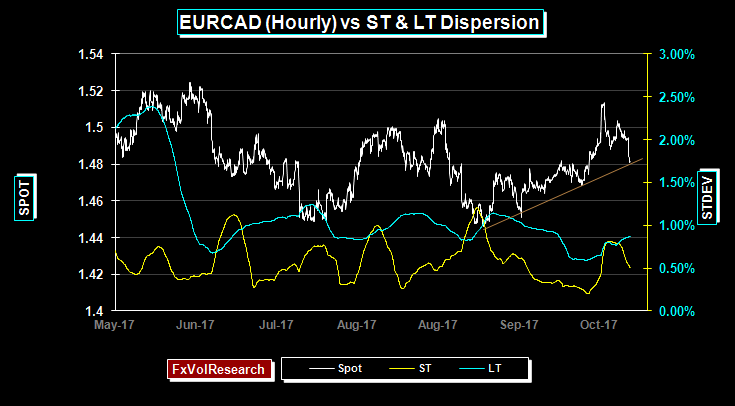
EURCAD testing the hourly trend line. Here too dispersion readings remain low and as we have pointed out EURCAD cross vols are now at their lows for 2017.
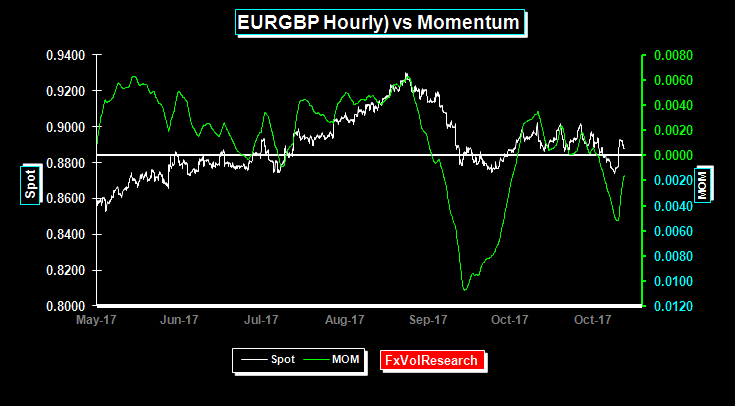
Owning EURGBP gamma has been rewarding, particularly last week. While we anticipated the dovish rate hike by the BoE we did not see such a soft forward guidenced posture. GBP is likely to remain choppy over the next 8 weeks as we get closure to a decision on whether there will be an interim agreement following the article 50 deadline.
A break of the key 8745 is required to set up the market for further GBP gains. If there is neither an agreement on an interim agreement nor the EU-UK exit bill then as the year draws to a close it will be increasingly apparent that the May government is not up to the task and the odds of the government falling and triggering another general election will rise.
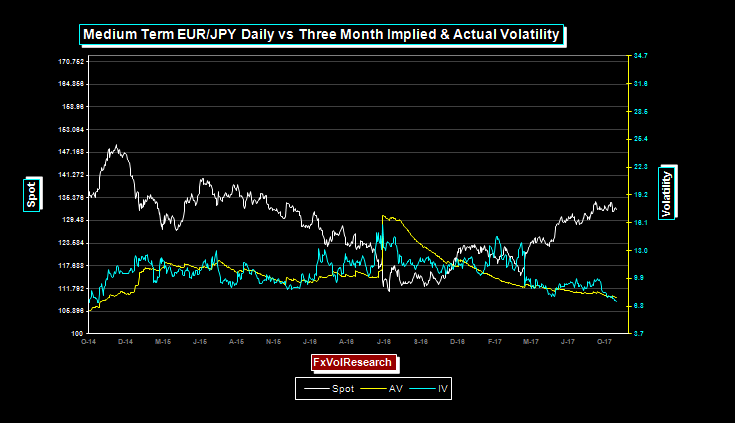
EURJPY vols are now the cheapest in our database both on a percentile basis and on an IV-AV basis. Based on Friday’s close three months 25 Delta strangles would be struck at 128.30 & 135.50 and the mid-market price based on Friday’s close would be approx 1.17% of the strike. The break even on this would be 126.80 & 137.08. The expiry date would be Jan 30, 2018.
The previous, when IV-AV spreads where this low in EURJPY the spot was back on 20 June, and the spot was 124.08. Three months later the spot had moved nearly 10 big figures to 133.80. A break of the previous tops at 134 would open up a move to 140, while a move under 128 would expose the 123/124 area.
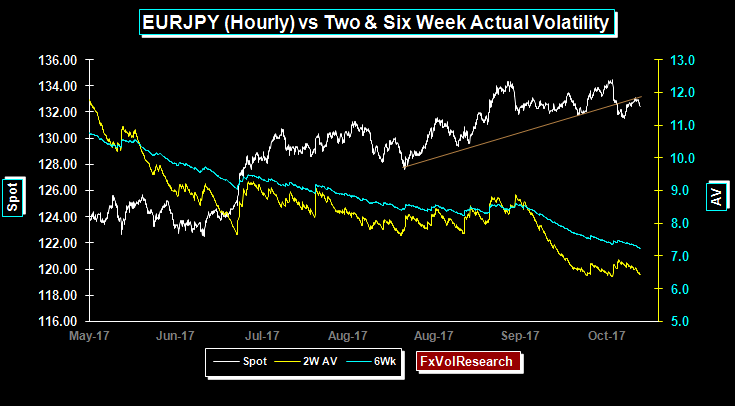
EURJPY actuals move lower over the week and the spot re-tested the top end of the trendline.
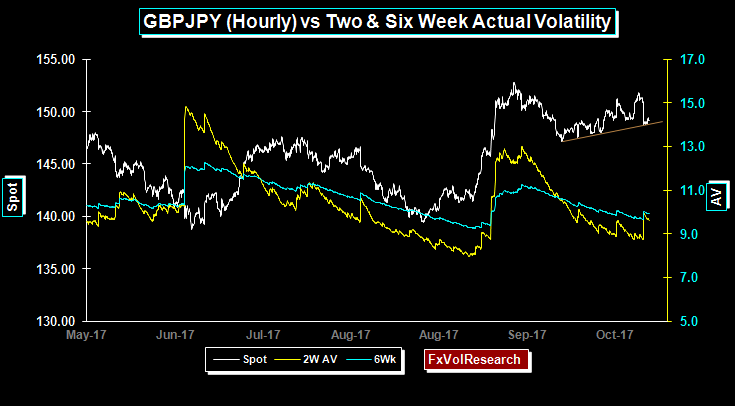
GBPJPY is also tests the hourly trend line while actual vol tries to rise but the two week fails to break above the six week measure.
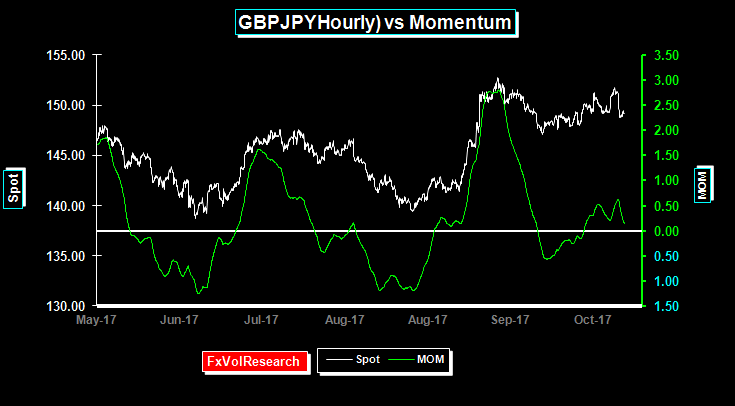
GBPJPY holding in positive momentum territory but the signals are weak. Similarly to EURJPY, GBPJPY is vulnerable to a hard sell off, but the premium levels in GBPJPY are not in the ultra cheap zone as EURJPY.
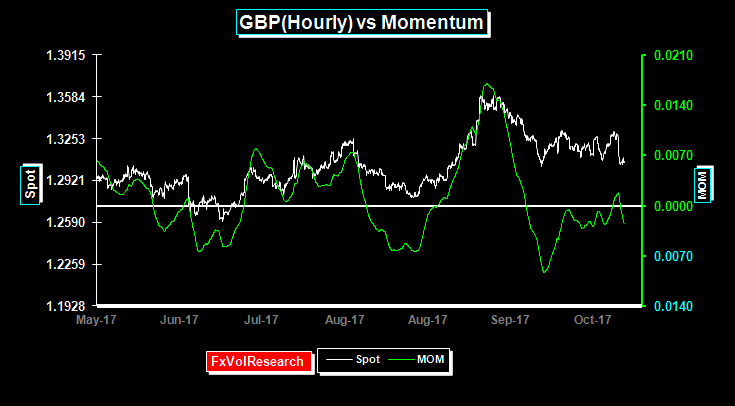
GBPUSD momentum also trades around the neutral line but ends the week slightly negative.
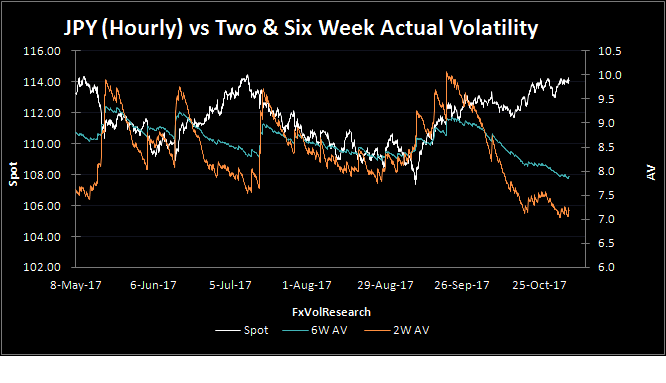
While Yen actuals are low they are still below the premium levels. There are better opportunities in EURJPY and GBPJPY.
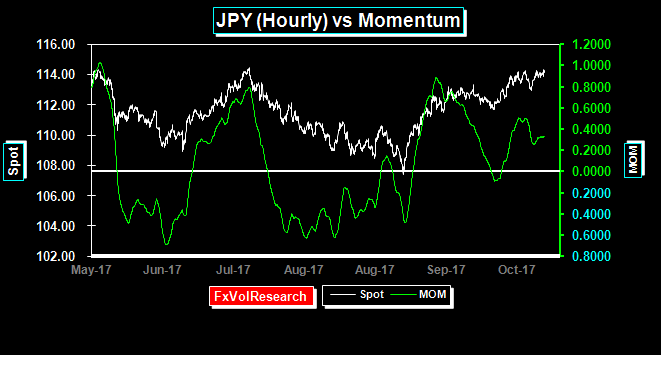
Weak momentum divergence. As we have pointed out above stretched Yen positioning is vulnerable to a sustained Yen correction.
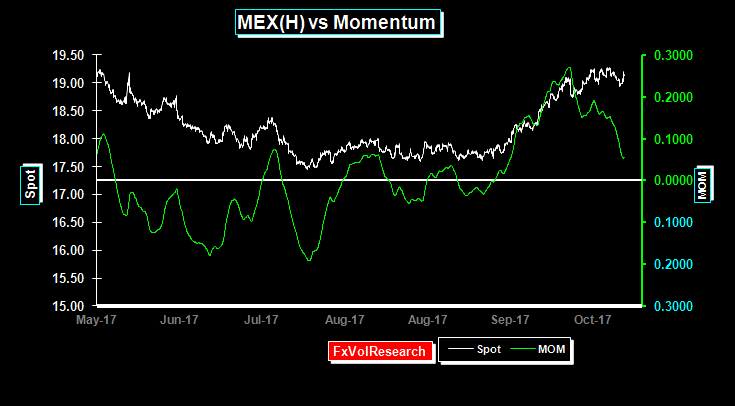
The MXP has tried and failed to get through the topside at 19.25. The chart above is showing clear signs of momentum divergence. One month MXP risk reversals have moved toward lower premiums for US$ calls. With the NAFTA negotiations unlikely to be resolved until March the spot is due for a longer period of consolidation. If NAFTA is torn up, then a medium-term move back to the previous Dollar highs of 22 to the dollar is likely. In practice what is likely to happen is that the MXP is likely to depreciate by an amount equal to the new tariffs imposed and the US-MXP bilateral trade deficit will persist.
Source: James Rider – http://bit.ly/2zjY3pj


